US UAMY full analysis,charts,indicators,moving averages,SMA,DMA,EMA,ADX,MACD,RSIU S UAMY WideScreen charts, DMA,SMA,EMA technical analysis, forecast prediction, by indicators ADX,MACD,RSI,CCI AMEX stock exchange
Daily price and charts and targets US Strong Daily Stock price targets for US UAMY are 5.67 and 6.66 | Daily Target 1 | 4.86 | | Daily Target 2 | 5.48 | | Daily Target 3 | 5.8466666666667 | | Daily Target 4 | 6.47 | | Daily Target 5 | 6.84 |
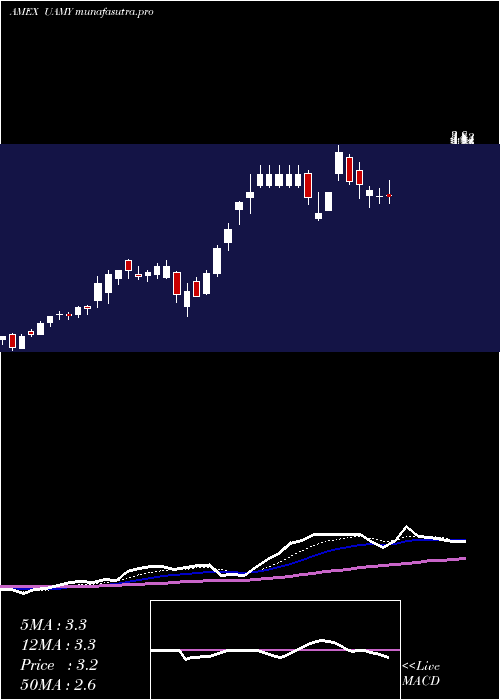
Daily price and volume U S
| Date |
Closing |
Open |
Range |
Volume |
Thu 04 December 2025 |
6.11 (14.85%) |
5.35 |
5.22 - 6.21 |
1.7489 times |
Wed 03 December 2025 |
5.32 (-0.75%) |
5.36 |
5.16 - 5.40 |
0.6694 times |
Tue 02 December 2025 |
5.36 (-2.19%) |
5.49 |
5.35 - 5.64 |
0.7285 times |
Mon 01 December 2025 |
5.48 (-10.31%) |
5.99 |
5.44 - 6.05 |
1.1512 times |
Fri 28 November 2025 |
6.11 (5.71%) |
5.86 |
5.78 - 6.19 |
0.6216 times |
Wed 26 November 2025 |
5.78 (0%) |
5.91 |
5.69 - 5.95 |
0.587 times |
Tue 25 November 2025 |
5.78 (-1.7%) |
5.93 |
5.48 - 6.00 |
0.686 times |
Mon 24 November 2025 |
5.88 (0.17%) |
5.90 |
5.75 - 6.00 |
0.7648 times |
Fri 21 November 2025 |
5.87 (-0.17%) |
5.90 |
5.41 - 5.98 |
1.4288 times |
Thu 20 November 2025 |
5.88 (-12.76%) |
6.93 |
5.84 - 7.06 |
1.6139 times |
Wed 19 November 2025 |
6.74 (-4.67%) |
7.32 |
6.73 - 7.46 |
1.0627 times |
Weekly price and charts US Strong weekly Stock price targets for US UAMY are 5.64 and 6.69 | Weekly Target 1 | 4.78 | | Weekly Target 2 | 5.44 | | Weekly Target 3 | 5.8266666666667 | | Weekly Target 4 | 6.49 | | Weekly Target 5 | 6.88 |
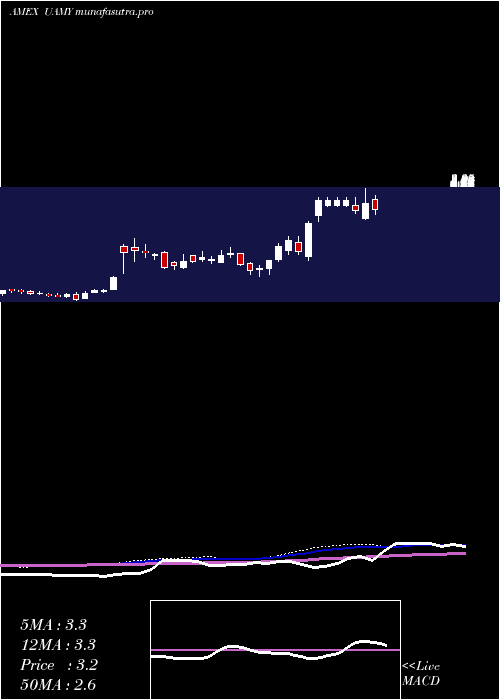
Weekly price and volumes for U S
| Date |
Closing |
Open |
Range |
Volume |
Thu 04 December 2025 |
6.11 (0%) |
5.99 |
5.16 - 6.21 |
0.52 times |
Fri 28 November 2025 |
6.11 (4.09%) |
5.90 |
5.48 - 6.19 |
0.3218 times |
Fri 21 November 2025 |
5.87 (-20.46%) |
7.39 |
5.41 - 7.46 |
0.76 times |
Fri 14 November 2025 |
7.38 (-11.51%) |
8.49 |
6.57 - 8.60 |
0.9628 times |
Fri 07 November 2025 |
8.34 (3.35%) |
6.50 |
6.24 - 8.49 |
1.0186 times |
Fri 31 October 2025 |
8.07 (0%) |
8.14 |
7.71 - 8.31 |
0.2223 times |
Fri 31 October 2025 |
8.07 (-32.64%) |
10.16 |
7.71 - 10.27 |
1.6195 times |
Fri 24 October 2025 |
11.98 (7.06%) |
12.20 |
11.02 - 13.84 |
1.7625 times |
Fri 17 October 2025 |
11.19 (44.39%) |
8.00 |
7.60 - 16.71 |
1.9828 times |
Fri 03 October 2025 |
7.75 (24%) |
6.42 |
5.95 - 8.40 |
0.8298 times |
Fri 26 September 2025 |
6.25 (-3.7%) |
6.50 |
6.01 - 8.17 |
1.2007 times |
Monthly price and charts US Strong monthly Stock price targets for US UAMY are 5.64 and 6.69 | Monthly Target 1 | 4.78 | | Monthly Target 2 | 5.44 | | Monthly Target 3 | 5.8266666666667 | | Monthly Target 4 | 6.49 | | Monthly Target 5 | 6.88 |
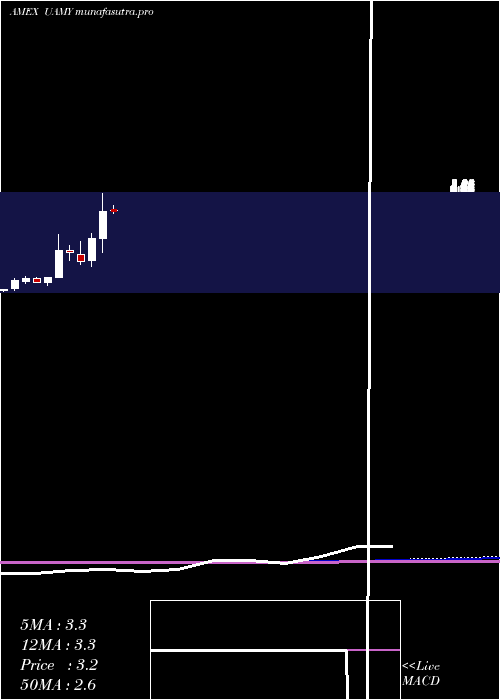
Monthly price and volumes U S
| Date |
Closing |
Open |
Range |
Volume |
Thu 04 December 2025 |
6.11 (0%) |
5.99 |
5.16 - 6.21 |
0.2345 times |
Fri 28 November 2025 |
6.11 (-24.29%) |
6.50 |
5.41 - 8.60 |
1.3815 times |
Fri 31 October 2025 |
8.07 (30.16%) |
6.75 |
6.67 - 16.71 |
2.7987 times |
Tue 30 September 2025 |
6.20 (36.26%) |
4.45 |
4.14 - 8.17 |
1.2898 times |
Fri 29 August 2025 |
4.55 (48.69%) |
2.95 |
2.88 - 5.13 |
0.9768 times |
Thu 31 July 2025 |
3.06 (40.37%) |
2.23 |
1.94 - 4.19 |
1.001 times |
Mon 30 June 2025 |
2.18 (-9.92%) |
2.43 |
2.12 - 3.56 |
0.7381 times |
Fri 30 May 2025 |
2.42 (-24.61%) |
3.23 |
2.30 - 3.84 |
0.5419 times |
Wed 30 April 2025 |
3.21 (45.91%) |
2.21 |
1.69 - 3.86 |
0.6945 times |
Mon 31 March 2025 |
2.20 (59.42%) |
1.42 |
1.21 - 2.41 |
0.3431 times |
Fri 28 February 2025 |
1.38 (-19.77%) |
1.64 |
1.26 - 2.09 |
0.3411 times |
DMA SMA EMA moving averages of U S UAMY
DMA (daily moving average) of U S UAMY
| DMA period | DMA value | | 5 day DMA | 5.68 | | 12 day DMA | 5.95 | | 20 day DMA | 6.58 | | 35 day DMA | 8.08 | | 50 day DMA | 7.88 | | 100 day DMA | 5.94 | | 150 day DMA | 4.89 | | 200 day DMA | 4.2 | EMA (exponential moving average) of U S UAMY
| EMA period | EMA current | EMA prev | EMA prev2 | | 5 day EMA | 5.74 | 5.56 | 5.68 | | 12 day EMA | 6.06 | 6.05 | 6.18 | | 20 day EMA | 6.49 | 6.53 | 6.66 | | 35 day EMA | 6.92 | 6.97 | 7.07 | | 50 day EMA | 7.43 | 7.48 | 7.57 |
SMA (simple moving average) of U S UAMY
| SMA period | SMA current | SMA prev | SMA prev2 | | 5 day SMA | 5.68 | 5.61 | 5.7 | | 12 day SMA | 5.95 | 6.01 | 6.18 | | 20 day SMA | 6.58 | 6.59 | 6.68 | | 35 day SMA | 8.08 | 8.3 | 8.39 | | 50 day SMA | 7.88 | 7.87 | 7.87 | | 100 day SMA | 5.94 | 5.9 | 5.87 | | 150 day SMA | 4.89 | 4.88 | 4.86 | | 200 day SMA | 4.2 | 4.18 | 4.16 |
|
|
