UltrashortRussell TWM full analysis,charts,indicators,moving averages,SMA,DMA,EMA,ADX,MACD,RSIUltrashort Russell TWM WideScreen charts, DMA,SMA,EMA technical analysis, forecast prediction, by indicators ADX,MACD,RSI,CCI AMEX stock exchange
Daily price and charts and targets UltrashortRussell Strong Daily Stock price targets for UltrashortRussell TWM are 31.94 and 32.9 | Daily Target 1 | 31.75 | | Daily Target 2 | 32.13 | | Daily Target 3 | 32.706666666667 | | Daily Target 4 | 33.09 | | Daily Target 5 | 33.67 |
Daily price and volume Ultrashort Russell
| Date |
Closing |
Open |
Range |
Volume |
Thu 23 October 2025 |
32.52 (-2.4%) |
33.01 |
32.32 - 33.28 |
0.9543 times |
Wed 22 October 2025 |
33.32 (2.97%) |
32.63 |
32.44 - 34.01 |
1.7549 times |
Tue 21 October 2025 |
32.36 (0.9%) |
32.27 |
32.02 - 32.74 |
0.4763 times |
Mon 20 October 2025 |
32.07 (-3.78%) |
32.78 |
32.01 - 32.89 |
0.5559 times |
Fri 17 October 2025 |
33.33 (1.34%) |
33.98 |
32.90 - 34.11 |
0.4646 times |
Thu 16 October 2025 |
32.89 (4.25%) |
31.34 |
31.24 - 33.17 |
1.0997 times |
Wed 15 October 2025 |
31.55 (-1.99%) |
31.53 |
30.96 - 32.38 |
1.1223 times |
Tue 14 October 2025 |
32.19 (-2.78%) |
33.95 |
31.72 - 34.15 |
1.2285 times |
Mon 13 October 2025 |
33.11 (-5.51%) |
33.86 |
33.04 - 33.95 |
0.8871 times |
Fri 10 October 2025 |
35.04 (5.99%) |
32.89 |
32.61 - 35.10 |
1.4564 times |
Thu 09 October 2025 |
33.06 (1.38%) |
32.73 |
32.49 - 33.32 |
0.5152 times |
Weekly price and charts UltrashortRussell Strong weekly Stock price targets for UltrashortRussell TWM are 31.27 and 33.27 | Weekly Target 1 | 30.85 | | Weekly Target 2 | 31.68 | | Weekly Target 3 | 32.846666666667 | | Weekly Target 4 | 33.68 | | Weekly Target 5 | 34.85 |
Weekly price and volumes for Ultrashort Russell
| Date |
Closing |
Open |
Range |
Volume |
Thu 23 October 2025 |
32.52 (-2.43%) |
32.78 |
32.01 - 34.01 |
1.7689 times |
Fri 17 October 2025 |
33.33 (-4.88%) |
33.86 |
30.96 - 34.15 |
2.2704 times |
Fri 10 October 2025 |
35.04 (6.63%) |
32.49 |
32.15 - 35.10 |
1.4738 times |
Fri 03 October 2025 |
32.86 (-3.3%) |
33.58 |
32.24 - 34.56 |
0.8086 times |
Fri 26 September 2025 |
33.98 (0.12%) |
34.15 |
32.81 - 35.05 |
0.707 times |
Fri 19 September 2025 |
33.94 (-4.37%) |
35.22 |
33.22 - 35.74 |
0.7336 times |
Fri 12 September 2025 |
35.49 (-0.42%) |
35.40 |
34.71 - 36.34 |
0.9542 times |
Fri 05 September 2025 |
35.64 (-1.95%) |
37.33 |
35.05 - 37.50 |
0.5747 times |
Fri 29 August 2025 |
36.35 (0%) |
35.88 |
35.84 - 36.58 |
0.1756 times |
Fri 29 August 2025 |
36.35 (-0.14%) |
36.64 |
35.76 - 37.16 |
0.5332 times |
Fri 22 August 2025 |
36.40 (-6.74%) |
38.99 |
36.20 - 40.21 |
0.6123 times |
Monthly price and charts UltrashortRussell Strong monthly Stock price targets for UltrashortRussell TWM are 29.67 and 33.81 | Monthly Target 1 | 28.72 | | Monthly Target 2 | 30.62 | | Monthly Target 3 | 32.86 | | Monthly Target 4 | 34.76 | | Monthly Target 5 | 37 |
Monthly price and volumes Ultrashort Russell
| Date |
Closing |
Open |
Range |
Volume |
Thu 23 October 2025 |
32.52 (-3.99%) |
34.26 |
30.96 - 35.10 |
1.5411 times |
Tue 30 September 2025 |
33.87 (-6.82%) |
37.33 |
32.81 - 37.50 |
0.8428 times |
Fri 29 August 2025 |
36.35 (-13.16%) |
43.11 |
35.76 - 44.60 |
0.7077 times |
Thu 31 July 2025 |
41.86 (-3.15%) |
43.66 |
39.17 - 43.78 |
0.7915 times |
Mon 30 June 2025 |
43.22 (-10.79%) |
48.39 |
42.57 - 49.61 |
0.5437 times |
Fri 30 May 2025 |
48.45 (-9.86%) |
53.31 |
46.20 - 54.39 |
0.7603 times |
Wed 30 April 2025 |
53.75 (-0.19%) |
54.16 |
51.81 - 71.27 |
1.1298 times |
Mon 31 March 2025 |
53.85 (13.75%) |
47.03 |
46.79 - 55.97 |
1.0611 times |
Fri 28 February 2025 |
47.34 (11.6%) |
44.29 |
40.90 - 49.02 |
1.4835 times |
Fri 31 January 2025 |
42.42 (-4.55%) |
43.66 |
41.00 - 47.38 |
1.1383 times |
Tue 31 December 2024 |
44.44 (15.94%) |
38.11 |
37.94 - 46.33 |
0.8008 times |

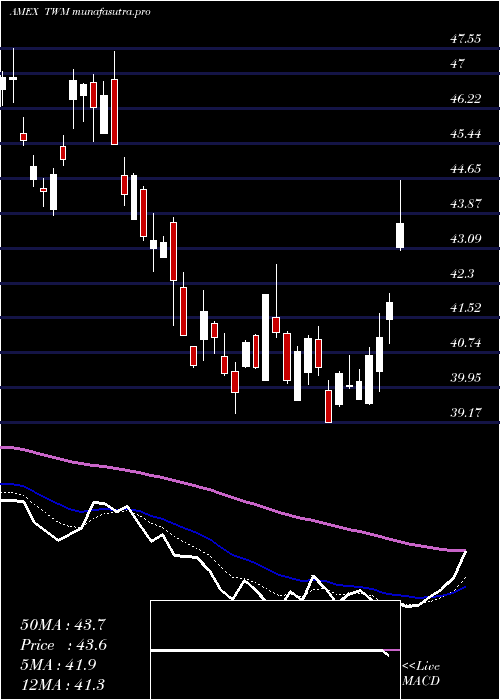
DMA SMA EMA moving averages of Ultrashort Russell TWM
DMA (daily moving average) of Ultrashort Russell TWM
| DMA period | DMA value | | 5 day DMA | 32.72 | | 12 day DMA | 32.84 | | 20 day DMA | 33.08 | | 35 day DMA | 33.82 | | 50 day DMA | 34.89 | | 100 day DMA | 38.72 | | 150 day DMA | 43.72 | | 200 day DMA | 44.23 | EMA (exponential moving average) of Ultrashort Russell TWM
| EMA period | EMA current | EMA prev | EMA prev2 | | 5 day EMA | 32.7 | 32.79 | 32.53 | | 12 day EMA | 32.86 | 32.92 | 32.85 | | 20 day EMA | 33.2 | 33.27 | 33.27 | | 35 day EMA | 34.13 | 34.22 | 34.27 | | 50 day EMA | 35.07 | 35.17 | 35.25 |
SMA (simple moving average) of Ultrashort Russell TWM
| SMA period | SMA current | SMA prev | SMA prev2 | | 5 day SMA | 32.72 | 32.79 | 32.44 | | 12 day SMA | 32.84 | 32.9 | 32.84 | | 20 day SMA | 33.08 | 33.19 | 33.22 | | 35 day SMA | 33.82 | 33.92 | 34.02 | | 50 day SMA | 34.89 | 35.01 | 35.1 | | 100 day SMA | 38.72 | 38.88 | 39.02 | | 150 day SMA | 43.72 | 43.84 | 43.97 | | 200 day SMA | 44.23 | 44.29 | 44.33 |
|
|
