RbsUs TRND full analysis,charts,indicators,moving averages,SMA,DMA,EMA,ADX,MACD,RSIRbs Us TRND WideScreen charts, DMA,SMA,EMA technical analysis, forecast prediction, by indicators ADX,MACD,RSI,CCI AMEX stock exchange
Daily price and charts and targets RbsUs Strong Daily Stock price targets for RbsUs TRND are 33.9 and 34.04 | Daily Target 1 | 33.78 | | Daily Target 2 | 33.88 | | Daily Target 3 | 33.923333333333 | | Daily Target 4 | 34.02 | | Daily Target 5 | 34.06 |
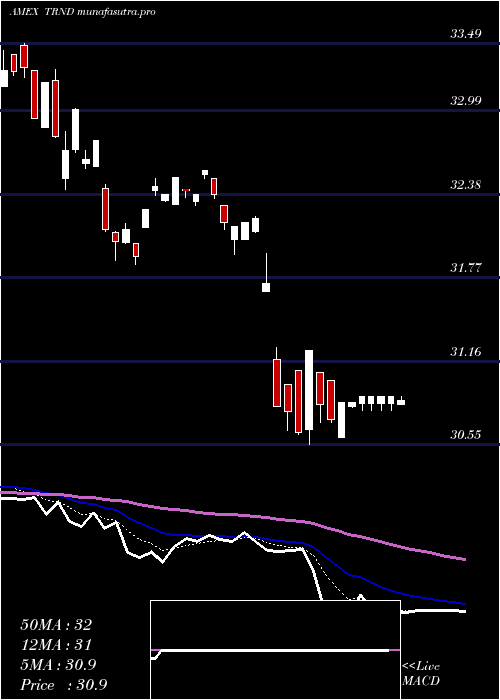
Daily price and volume Rbs Us
| Date |
Closing |
Open |
Range |
Volume |
Thu 23 October 2025 |
33.97 (0.98%) |
33.83 |
33.83 - 33.97 |
0.0367 times |
Wed 22 October 2025 |
33.64 (-0.85%) |
33.76 |
33.59 - 33.76 |
0.191 times |
Tue 21 October 2025 |
33.93 (0%) |
33.88 |
33.88 - 33.95 |
0.067 times |
Mon 20 October 2025 |
33.93 (0.86%) |
33.85 |
33.85 - 33.94 |
0.3689 times |
Fri 17 October 2025 |
33.64 (0.39%) |
33.48 |
33.42 - 33.68 |
5.0428 times |
Thu 16 October 2025 |
33.51 (-0.3%) |
33.71 |
33.46 - 33.80 |
0.1705 times |
Wed 15 October 2025 |
33.61 (0.36%) |
33.77 |
33.45 - 33.77 |
0.1705 times |
Tue 14 October 2025 |
33.49 (0.09%) |
33.50 |
33.46 - 33.64 |
1.8393 times |
Mon 13 October 2025 |
33.46 (-0.86%) |
33.12 |
33.12 - 33.46 |
0.1279 times |
Tue 07 October 2025 |
33.75 (-0.65%) |
33.71 |
33.70 - 33.75 |
1.9854 times |
Mon 06 October 2025 |
33.97 (0.35%) |
33.94 |
33.94 - 34.02 |
0.1283 times |
Weekly price and charts RbsUs Strong weekly Stock price targets for RbsUs TRND are 33.78 and 34.16 | Weekly Target 1 | 33.46 | | Weekly Target 2 | 33.72 | | Weekly Target 3 | 33.843333333333 | | Weekly Target 4 | 34.1 | | Weekly Target 5 | 34.22 |
Weekly price and volumes for Rbs Us
| Date |
Closing |
Open |
Range |
Volume |
Thu 23 October 2025 |
33.97 (0.98%) |
33.85 |
33.59 - 33.97 |
0.2781 times |
Fri 17 October 2025 |
33.64 (-0.33%) |
33.12 |
33.12 - 33.80 |
3.0809 times |
Tue 07 October 2025 |
33.75 (-0.3%) |
33.94 |
33.70 - 34.02 |
0.8859 times |
Fri 03 October 2025 |
33.85 (1.26%) |
33.52 |
33.46 - 33.88 |
0.2928 times |
Fri 26 September 2025 |
33.43 (-0.48%) |
33.72 |
32.60 - 33.77 |
0.2757 times |
Fri 19 September 2025 |
33.59 (0.72%) |
33.40 |
33.18 - 33.64 |
3.8134 times |
Fri 12 September 2025 |
33.35 (0.91%) |
33.09 |
33.01 - 33.42 |
0.2119 times |
Fri 05 September 2025 |
33.05 (0.76%) |
32.38 |
32.38 - 33.23 |
0.3191 times |
Fri 29 August 2025 |
32.80 (0%) |
32.89 |
32.35 - 32.89 |
0.1736 times |
Fri 29 August 2025 |
32.80 (-0.46%) |
32.56 |
32.35 - 33.03 |
0.6688 times |
Fri 22 August 2025 |
32.95 (0.8%) |
32.73 |
32.41 - 32.95 |
0.3242 times |

Monthly price and charts RbsUs Strong monthly Stock price targets for RbsUs TRND are 33.55 and 34.45 | Monthly Target 1 | 32.8 | | Monthly Target 2 | 33.39 | | Monthly Target 3 | 33.703333333333 | | Monthly Target 4 | 34.29 | | Monthly Target 5 | 34.6 |
Monthly price and volumes Rbs Us
| Date |
Closing |
Open |
Range |
Volume |
Thu 23 October 2025 |
33.97 (1.1%) |
33.61 |
33.12 - 34.02 |
0.9758 times |
Tue 30 September 2025 |
33.60 (2.44%) |
32.38 |
32.38 - 33.77 |
1.1109 times |
Fri 29 August 2025 |
32.80 (2.4%) |
31.55 |
31.55 - 33.03 |
0.4007 times |
Thu 31 July 2025 |
32.03 (0.28%) |
31.83 |
31.66 - 32.52 |
0.6109 times |
Mon 30 June 2025 |
31.94 (3.07%) |
30.95 |
30.95 - 31.94 |
1.4576 times |
Fri 30 May 2025 |
30.99 (-0.06%) |
30.92 |
30.54 - 31.02 |
1.0431 times |
Wed 30 April 2025 |
31.01 (-3.55%) |
32.05 |
30.55 - 32.22 |
2.1843 times |
Mon 31 March 2025 |
32.15 (-3.16%) |
33.22 |
31.87 - 33.30 |
0.4398 times |
Fri 28 February 2025 |
33.20 (-0.42%) |
32.88 |
32.87 - 33.90 |
0.8247 times |
Fri 31 January 2025 |
33.34 (2.68%) |
32.91 |
31.99 - 33.71 |
0.9523 times |
Tue 31 December 2024 |
32.47 (-4.61%) |
34.20 |
32.38 - 34.41 |
0.4642 times |

DMA SMA EMA moving averages of Rbs Us TRND
DMA (daily moving average) of Rbs Us TRND
| DMA period | DMA value | | 5 day DMA | 33.82 | | 12 day DMA | 33.73 | | 20 day DMA | 33.66 | | 35 day DMA | 33.48 | | 50 day DMA | 33.26 | | 100 day DMA | 32.5 | | 150 day DMA | 32.08 | | 200 day DMA | 32.33 | EMA (exponential moving average) of Rbs Us TRND
| EMA period | EMA current | EMA prev | EMA prev2 | | 5 day EMA | 33.81 | 33.73 | 33.78 | | 12 day EMA | 33.73 | 33.69 | 33.7 | | 20 day EMA | 33.64 | 33.6 | 33.6 | | 35 day EMA | 33.42 | 33.39 | 33.38 | | 50 day EMA | 33.23 | 33.2 | 33.18 |
SMA (simple moving average) of Rbs Us TRND
| SMA period | SMA current | SMA prev | SMA prev2 | | 5 day SMA | 33.82 | 33.73 | 33.72 | | 12 day SMA | 33.73 | 33.72 | 33.73 | | 20 day SMA | 33.66 | 33.65 | 33.64 | | 35 day SMA | 33.48 | 33.45 | 33.42 | | 50 day SMA | 33.26 | 33.23 | 33.2 | | 100 day SMA | 32.5 | 32.47 | 32.44 | | 150 day SMA | 32.08 | 32.07 | 32.05 | | 200 day SMA | 32.33 | 32.32 | 32.31 |
|
|
