TimothyPlan TPLC full analysis,charts,indicators,moving averages,SMA,DMA,EMA,ADX,MACD,RSITimothy Plan TPLC WideScreen charts, DMA,SMA,EMA technical analysis, forecast prediction, by indicators ADX,MACD,RSI,CCI AMEX stock exchange
Daily price and charts and targets TimothyPlan Strong Daily Stock price targets for TimothyPlan TPLC are 46.04 and 46.34 | Daily Target 1 | 45.99 | | Daily Target 2 | 46.09 | | Daily Target 3 | 46.29 | | Daily Target 4 | 46.39 | | Daily Target 5 | 46.59 |
Daily price and volume Timothy Plan
| Date |
Closing |
Open |
Range |
Volume |
Fri 24 October 2025 |
46.19 (0.09%) |
46.49 |
46.19 - 46.49 |
0.6796 times |
Thu 23 October 2025 |
46.15 (0.65%) |
45.97 |
45.84 - 46.23 |
0.5293 times |
Wed 22 October 2025 |
45.85 (-0.69%) |
46.16 |
45.85 - 46.18 |
1.1625 times |
Tue 21 October 2025 |
46.17 (0.37%) |
45.88 |
45.88 - 46.24 |
3.5972 times |
Mon 20 October 2025 |
46.00 (1.1%) |
45.80 |
45.76 - 46.02 |
1.0692 times |
Fri 17 October 2025 |
45.50 (0.31%) |
45.47 |
45.26 - 45.59 |
0.5776 times |
Thu 16 October 2025 |
45.36 (-0.83%) |
45.93 |
45.27 - 45.93 |
0.5053 times |
Wed 15 October 2025 |
45.74 (0%) |
46.04 |
45.58 - 46.07 |
0.62 times |
Tue 14 October 2025 |
45.74 (0.62%) |
45.08 |
45.08 - 45.94 |
0.7233 times |
Mon 13 October 2025 |
45.46 (1.09%) |
45.41 |
45.34 - 45.55 |
0.536 times |
Fri 10 October 2025 |
44.97 (-2.11%) |
46.01 |
44.97 - 46.05 |
6.5615 times |

Weekly price and charts TimothyPlan Strong weekly Stock price targets for TimothyPlan TPLC are 45.98 and 46.71 | Weekly Target 1 | 45.42 | | Weekly Target 2 | 45.8 | | Weekly Target 3 | 46.146666666667 | | Weekly Target 4 | 46.53 | | Weekly Target 5 | 46.88 |
Weekly price and volumes for Timothy Plan
| Date |
Closing |
Open |
Range |
Volume |
Fri 24 October 2025 |
46.19 (1.52%) |
45.80 |
45.76 - 46.49 |
1.1669 times |
Fri 17 October 2025 |
45.50 (1.18%) |
45.41 |
45.08 - 46.07 |
0.4911 times |
Fri 10 October 2025 |
44.97 (-3.39%) |
46.82 |
44.97 - 46.82 |
1.8248 times |
Fri 03 October 2025 |
46.55 (1.17%) |
46.27 |
45.95 - 46.83 |
1.0058 times |
Fri 26 September 2025 |
46.01 (0.09%) |
45.82 |
45.42 - 46.32 |
2.3997 times |
Fri 19 September 2025 |
45.97 (-0.11%) |
46.17 |
45.60 - 46.27 |
0.8309 times |
Fri 12 September 2025 |
46.02 (-0.02%) |
46.10 |
45.59 - 46.43 |
0.7485 times |
Fri 05 September 2025 |
46.03 (0.22%) |
45.59 |
45.35 - 46.38 |
0.6468 times |
Fri 29 August 2025 |
45.93 (0%) |
46.09 |
45.80 - 46.18 |
0.2516 times |
Fri 29 August 2025 |
45.93 (-0.65%) |
46.13 |
45.80 - 46.18 |
0.6339 times |
Fri 22 August 2025 |
46.23 (1.92%) |
45.40 |
45.35 - 46.43 |
1.9424 times |
Monthly price and charts TimothyPlan Strong monthly Stock price targets for TimothyPlan TPLC are 45.58 and 47.44 | Monthly Target 1 | 44.14 | | Monthly Target 2 | 45.16 | | Monthly Target 3 | 45.996666666667 | | Monthly Target 4 | 47.02 | | Monthly Target 5 | 47.86 |
Monthly price and volumes Timothy Plan
| Date |
Closing |
Open |
Range |
Volume |
Fri 24 October 2025 |
46.19 (-0.24%) |
46.15 |
44.97 - 46.83 |
0.5683 times |
Tue 30 September 2025 |
46.30 (0.81%) |
45.59 |
45.35 - 46.43 |
0.7142 times |
Fri 29 August 2025 |
45.93 (1.37%) |
44.98 |
44.44 - 46.43 |
0.6725 times |
Thu 31 July 2025 |
45.31 (0.91%) |
44.86 |
44.59 - 46.26 |
0.6055 times |
Mon 30 June 2025 |
44.90 (2.53%) |
43.79 |
43.25 - 45.00 |
1.0294 times |
Fri 30 May 2025 |
43.79 (4.99%) |
41.90 |
41.74 - 44.70 |
1.0856 times |
Wed 30 April 2025 |
41.71 (-1.72%) |
42.46 |
37.15 - 43.16 |
2.3318 times |
Mon 31 March 2025 |
42.44 (-3.13%) |
44.04 |
41.02 - 44.04 |
0.9139 times |
Fri 28 February 2025 |
43.81 (-1.88%) |
43.99 |
43.25 - 44.82 |
0.5659 times |
Fri 31 January 2025 |
44.65 (4.25%) |
43.20 |
42.48 - 45.35 |
1.5129 times |
Tue 31 December 2024 |
42.83 (-7.47%) |
46.02 |
42.49 - 46.03 |
0.4416 times |
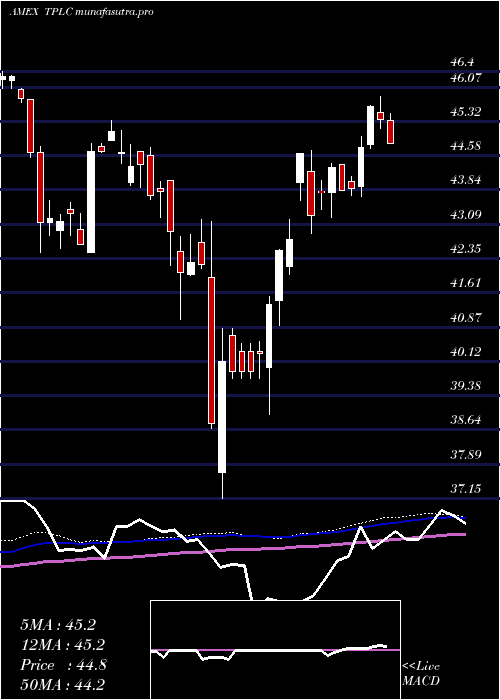
DMA SMA EMA moving averages of Timothy Plan TPLC
DMA (daily moving average) of Timothy Plan TPLC
| DMA period | DMA value | | 5 day DMA | 46.07 | | 12 day DMA | 45.76 | | 20 day DMA | 46 | | 35 day DMA | 45.98 | | 50 day DMA | 45.93 | | 100 day DMA | 45.46 | | 150 day DMA | 44.31 | | 200 day DMA | 44.17 | EMA (exponential moving average) of Timothy Plan TPLC
| EMA period | EMA current | EMA prev | EMA prev2 | | 5 day EMA | 46.04 | 45.96 | 45.86 | | 12 day EMA | 45.94 | 45.9 | 45.85 | | 20 day EMA | 45.94 | 45.91 | 45.89 | | 35 day EMA | 45.92 | 45.9 | 45.89 | | 50 day EMA | 45.9 | 45.89 | 45.88 |
SMA (simple moving average) of Timothy Plan TPLC
| SMA period | SMA current | SMA prev | SMA prev2 | | 5 day SMA | 46.07 | 45.93 | 45.78 | | 12 day SMA | 45.76 | 45.78 | 45.78 | | 20 day SMA | 46 | 45.99 | 45.96 | | 35 day SMA | 45.98 | 45.97 | 45.97 | | 50 day SMA | 45.93 | 45.91 | 45.9 | | 100 day SMA | 45.46 | 45.44 | 45.42 | | 150 day SMA | 44.31 | 44.28 | 44.26 | | 200 day SMA | 44.17 | 44.16 | 44.14 |
|
|
