TimothyPlan TPIF full analysis,charts,indicators,moving averages,SMA,DMA,EMA,ADX,MACD,RSITimothy Plan TPIF WideScreen charts, DMA,SMA,EMA technical analysis, forecast prediction, by indicators ADX,MACD,RSI,CCI AMEX stock exchange
Daily price and charts and targets TimothyPlan Strong Daily Stock price targets for TimothyPlan TPIF are 33.67 and 33.93 | Daily Target 1 | 33.6 | | Daily Target 2 | 33.73 | | Daily Target 3 | 33.863333333333 | | Daily Target 4 | 33.99 | | Daily Target 5 | 34.12 |
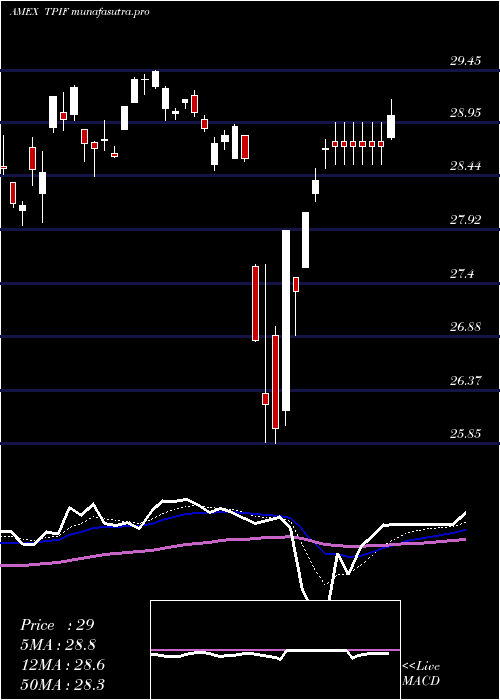
Daily price and volume Timothy Plan
| Date |
Closing |
Open |
Range |
Volume |
Thu 23 October 2025 |
33.85 (0.68%) |
34.00 |
33.74 - 34.00 |
1.0156 times |
Wed 22 October 2025 |
33.62 (0.24%) |
33.56 |
33.48 - 33.63 |
0.7267 times |
Tue 21 October 2025 |
33.54 (-0.74%) |
33.61 |
33.45 - 33.61 |
0.9207 times |
Mon 20 October 2025 |
33.79 (0.69%) |
33.67 |
33.67 - 33.79 |
1.6887 times |
Fri 17 October 2025 |
33.56 (-0.06%) |
33.41 |
33.36 - 33.56 |
0.2853 times |
Thu 16 October 2025 |
33.58 (0.45%) |
33.61 |
33.44 - 33.69 |
0.4661 times |
Wed 15 October 2025 |
33.43 (0.42%) |
33.37 |
33.27 - 33.51 |
0.9915 times |
Tue 14 October 2025 |
33.29 (0.51%) |
33.00 |
32.98 - 33.51 |
2.2107 times |
Mon 13 October 2025 |
33.12 (0.98%) |
33.00 |
33.00 - 33.18 |
0.9055 times |
Fri 10 October 2025 |
32.80 (-1.56%) |
33.33 |
32.78 - 33.33 |
0.7892 times |
Thu 09 October 2025 |
33.32 (-0.98%) |
33.68 |
33.23 - 33.68 |
2.0893 times |
Weekly price and charts TimothyPlan Strong weekly Stock price targets for TimothyPlan TPIF are 33.65 and 34.2 | Weekly Target 1 | 33.22 | | Weekly Target 2 | 33.53 | | Weekly Target 3 | 33.766666666667 | | Weekly Target 4 | 34.08 | | Weekly Target 5 | 34.32 |
Weekly price and volumes for Timothy Plan
| Date |
Closing |
Open |
Range |
Volume |
Thu 23 October 2025 |
33.85 (0.86%) |
33.67 |
33.45 - 34.00 |
0.6493 times |
Fri 17 October 2025 |
33.56 (2.32%) |
33.00 |
32.98 - 33.69 |
0.725 times |
Fri 10 October 2025 |
32.80 (-2.79%) |
33.82 |
32.78 - 33.90 |
1.4203 times |
Fri 03 October 2025 |
33.74 (1.87%) |
33.20 |
33.18 - 33.81 |
1.1055 times |
Fri 26 September 2025 |
33.12 (-0.48%) |
33.32 |
32.84 - 33.52 |
3.6549 times |
Fri 19 September 2025 |
33.28 (-0.66%) |
33.59 |
33.19 - 33.71 |
0.6409 times |
Fri 12 September 2025 |
33.50 (1.27%) |
33.29 |
33.16 - 36.02 |
0.5005 times |
Fri 05 September 2025 |
33.08 (0.36%) |
32.52 |
32.47 - 34.78 |
0.6159 times |
Fri 29 August 2025 |
32.96 (0%) |
32.98 |
32.87 - 33.00 |
0.2227 times |
Fri 29 August 2025 |
32.96 (-1.52%) |
33.35 |
32.78 - 33.35 |
0.465 times |
Fri 22 August 2025 |
33.47 (1.12%) |
33.04 |
32.91 - 33.54 |
0.5805 times |

Monthly price and charts TimothyPlan Strong monthly Stock price targets for TimothyPlan TPIF are 33.32 and 34.54 | Monthly Target 1 | 32.32 | | Monthly Target 2 | 33.09 | | Monthly Target 3 | 33.543333333333 | | Monthly Target 4 | 34.31 | | Monthly Target 5 | 34.76 |
Monthly price and volumes Timothy Plan
| Date |
Closing |
Open |
Range |
Volume |
Thu 23 October 2025 |
33.85 (1.41%) |
33.54 |
32.78 - 34.00 |
0.997 times |
Tue 30 September 2025 |
33.38 (1.27%) |
32.52 |
32.47 - 36.02 |
1.6746 times |
Fri 29 August 2025 |
32.96 (3.39%) |
31.92 |
31.64 - 33.54 |
0.7475 times |
Thu 31 July 2025 |
31.88 (-1.27%) |
32.28 |
31.81 - 33.07 |
0.7897 times |
Mon 30 June 2025 |
32.29 (2.54%) |
31.57 |
31.21 - 32.63 |
0.9366 times |
Fri 30 May 2025 |
31.49 (4.69%) |
30.18 |
30.00 - 31.62 |
1.3842 times |
Wed 30 April 2025 |
30.08 (4.63%) |
28.77 |
25.85 - 30.14 |
0.8106 times |
Mon 31 March 2025 |
28.75 (2.13%) |
28.71 |
27.99 - 29.45 |
0.6304 times |
Fri 28 February 2025 |
28.15 (2.7%) |
26.94 |
26.75 - 28.86 |
0.6611 times |
Fri 31 January 2025 |
27.41 (3.12%) |
26.55 |
25.89 - 27.78 |
1.3683 times |
Tue 31 December 2024 |
26.58 (-1.88%) |
27.66 |
26.21 - 27.86 |
0.4456 times |

DMA SMA EMA moving averages of Timothy Plan TPIF
DMA (daily moving average) of Timothy Plan TPIF
| DMA period | DMA value | | 5 day DMA | 33.67 | | 12 day DMA | 33.46 | | 20 day DMA | 33.48 | | 35 day DMA | 33.42 | | 50 day DMA | 33.3 | | 100 day DMA | 32.73 | | 150 day DMA | 31.68 | | 200 day DMA | 30.76 | EMA (exponential moving average) of Timothy Plan TPIF
| EMA period | EMA current | EMA prev | EMA prev2 | | 5 day EMA | 33.66 | 33.57 | 33.55 | | 12 day EMA | 33.56 | 33.51 | 33.49 | | 20 day EMA | 33.49 | 33.45 | 33.43 | | 35 day EMA | 33.4 | 33.37 | 33.35 | | 50 day EMA | 33.29 | 33.27 | 33.26 |
SMA (simple moving average) of Timothy Plan TPIF
| SMA period | SMA current | SMA prev | SMA prev2 | | 5 day SMA | 33.67 | 33.62 | 33.58 | | 12 day SMA | 33.46 | 33.44 | 33.46 | | 20 day SMA | 33.48 | 33.43 | 33.41 | | 35 day SMA | 33.42 | 33.4 | 33.37 | | 50 day SMA | 33.3 | 33.28 | 33.27 | | 100 day SMA | 32.73 | 32.71 | 32.69 | | 150 day SMA | 31.68 | 31.65 | 31.62 | | 200 day SMA | 30.76 | 30.72 | 30.69 |
|
|
