TimothyPlan TPHD full analysis,charts,indicators,moving averages,SMA,DMA,EMA,ADX,MACD,RSITimothy Plan TPHD WideScreen charts, DMA,SMA,EMA technical analysis, forecast prediction, by indicators ADX,MACD,RSI,CCI AMEX stock exchange
Daily price and charts and targets TimothyPlan Strong Daily Stock price targets for TimothyPlan TPHD are 38.68 and 38.99 | Daily Target 1 | 38.62 | | Daily Target 2 | 38.73 | | Daily Target 3 | 38.933333333333 | | Daily Target 4 | 39.04 | | Daily Target 5 | 39.24 |
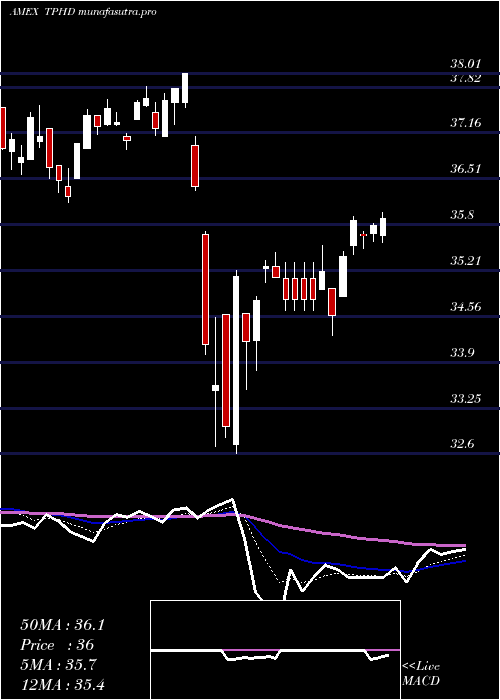
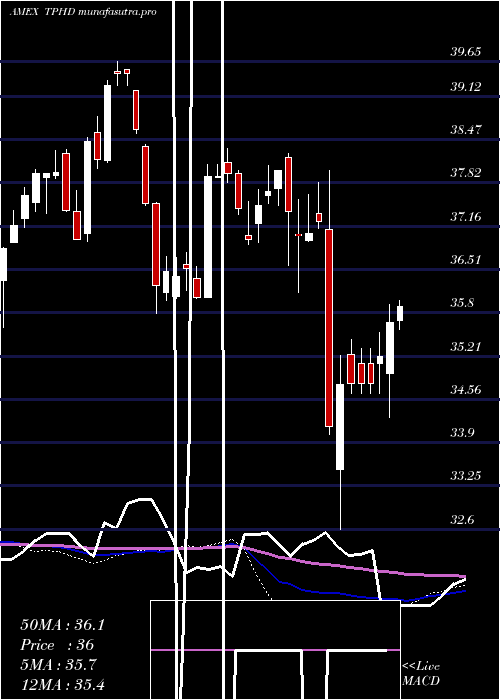
Daily price and volume Timothy Plan
| Date |
Closing |
Open |
Range |
Volume |
Fri 24 October 2025 |
38.83 (-0.41%) |
39.14 |
38.83 - 39.14 |
0.4799 times |
Thu 23 October 2025 |
38.99 (0.23%) |
38.94 |
38.17 - 39.10 |
0.8353 times |
Wed 22 October 2025 |
38.90 (-0.13%) |
38.97 |
38.86 - 39.15 |
0.7044 times |
Tue 21 October 2025 |
38.95 (0.26%) |
38.82 |
38.78 - 39.00 |
2.7939 times |
Mon 20 October 2025 |
38.85 (0.88%) |
38.67 |
38.65 - 38.85 |
0.6156 times |
Fri 17 October 2025 |
38.51 (0.52%) |
38.40 |
38.28 - 38.51 |
0.7125 times |
Thu 16 October 2025 |
38.31 (-1.08%) |
38.73 |
38.22 - 38.80 |
0.9767 times |
Wed 15 October 2025 |
38.73 (0.13%) |
38.76 |
38.56 - 38.95 |
0.9406 times |
Tue 14 October 2025 |
38.68 (0.89%) |
38.06 |
38.06 - 38.81 |
0.6644 times |
Mon 13 October 2025 |
38.34 (-2.22%) |
38.38 |
38.25 - 38.47 |
1.2769 times |
Tue 07 October 2025 |
39.21 (-0.56%) |
39.46 |
39.09 - 39.46 |
0.5524 times |
Weekly price and charts TimothyPlan Strong weekly Stock price targets for TimothyPlan TPHD are 38.5 and 39.48 | Weekly Target 1 | 37.74 | | Weekly Target 2 | 38.28 | | Weekly Target 3 | 38.716666666667 | | Weekly Target 4 | 39.26 | | Weekly Target 5 | 39.7 |
Weekly price and volumes for Timothy Plan
| Date |
Closing |
Open |
Range |
Volume |
Fri 24 October 2025 |
38.83 (0.83%) |
38.67 |
38.17 - 39.15 |
1.2393 times |
Fri 17 October 2025 |
38.51 (-1.79%) |
38.38 |
38.06 - 38.95 |
1.0435 times |
Tue 07 October 2025 |
39.21 (-0.56%) |
39.62 |
39.09 - 39.62 |
0.1984 times |
Fri 03 October 2025 |
39.43 (0.48%) |
39.46 |
39.05 - 39.67 |
0.8987 times |
Fri 26 September 2025 |
39.24 (1.11%) |
38.67 |
38.63 - 39.24 |
1.9508 times |
Fri 19 September 2025 |
38.81 (-0.41%) |
39.05 |
38.64 - 39.05 |
0.6149 times |
Fri 12 September 2025 |
38.97 (0.03%) |
38.94 |
38.50 - 39.21 |
2.7193 times |
Fri 05 September 2025 |
38.96 (-0.33%) |
38.89 |
38.53 - 39.16 |
0.6762 times |
Fri 29 August 2025 |
39.09 (0%) |
39.11 |
39.03 - 39.23 |
0.1279 times |
Fri 29 August 2025 |
39.09 (-0.84%) |
39.31 |
39.03 - 39.32 |
0.5309 times |
Fri 22 August 2025 |
39.42 (2.34%) |
38.55 |
38.37 - 39.57 |
1.3222 times |
Monthly price and charts TimothyPlan Strong monthly Stock price targets for TimothyPlan TPHD are 37.64 and 39.25 | Monthly Target 1 | 37.24 | | Monthly Target 2 | 38.04 | | Monthly Target 3 | 38.853333333333 | | Monthly Target 4 | 39.65 | | Monthly Target 5 | 40.46 |
Monthly price and volumes Timothy Plan
| Date |
Closing |
Open |
Range |
Volume |
Fri 24 October 2025 |
38.83 (-1.3%) |
39.22 |
38.06 - 39.67 |
0.4513 times |
Tue 30 September 2025 |
39.34 (0.64%) |
38.89 |
38.50 - 39.46 |
0.9238 times |
Fri 29 August 2025 |
39.09 (1.66%) |
38.28 |
37.78 - 39.57 |
0.5064 times |
Thu 31 July 2025 |
38.45 (1.72%) |
37.78 |
37.78 - 39.09 |
0.4774 times |
Mon 30 June 2025 |
37.80 (2.11%) |
37.15 |
36.79 - 37.94 |
1.708 times |
Fri 30 May 2025 |
37.02 (3.09%) |
35.81 |
35.75 - 37.86 |
0.4626 times |
Wed 30 April 2025 |
35.91 (-4.55%) |
37.60 |
32.60 - 38.01 |
3.1667 times |
Mon 31 March 2025 |
37.62 (-1%) |
38.20 |
36.17 - 38.25 |
0.7273 times |
Fri 28 February 2025 |
38.00 (1.52%) |
37.02 |
36.89 - 38.08 |
0.5033 times |
Fri 31 January 2025 |
37.43 (2.94%) |
36.64 |
36.08 - 38.34 |
1.0731 times |
Tue 31 December 2024 |
36.36 (-7.86%) |
39.21 |
35.85 - 39.21 |
0.4569 times |

DMA SMA EMA moving averages of Timothy Plan TPHD
DMA (daily moving average) of Timothy Plan TPHD
| DMA period | DMA value | | 5 day DMA | 38.9 | | 12 day DMA | 38.81 | | 20 day DMA | 38.98 | | 35 day DMA | 38.92 | | 50 day DMA | 38.93 | | 100 day DMA | 38.5 | | 150 day DMA | 37.74 | | 200 day DMA | 37.64 | EMA (exponential moving average) of Timothy Plan TPHD
| EMA period | EMA current | EMA prev | EMA prev2 | | 5 day EMA | 38.86 | 38.88 | 38.82 | | 12 day EMA | 38.86 | 38.87 | 38.85 | | 20 day EMA | 38.89 | 38.9 | 38.89 | | 35 day EMA | 38.89 | 38.89 | 38.88 | | 50 day EMA | 38.87 | 38.87 | 38.86 |
SMA (simple moving average) of Timothy Plan TPHD
| SMA period | SMA current | SMA prev | SMA prev2 | | 5 day SMA | 38.9 | 38.84 | 38.7 | | 12 day SMA | 38.81 | 38.86 | 38.88 | | 20 day SMA | 38.98 | 38.99 | 38.98 | | 35 day SMA | 38.92 | 38.92 | 38.92 | | 50 day SMA | 38.93 | 38.92 | 38.9 | | 100 day SMA | 38.5 | 38.48 | 38.47 | | 150 day SMA | 37.74 | 37.73 | 37.72 | | 200 day SMA | 37.64 | 37.63 | 37.61 |
|
|
