KokusaiIndex TOK full analysis,charts,indicators,moving averages,SMA,DMA,EMA,ADX,MACD,RSIKokusai Index TOK WideScreen charts, DMA,SMA,EMA technical analysis, forecast prediction, by indicators ADX,MACD,RSI,CCI AMEX stock exchange
Daily price and charts and targets KokusaiIndex Strong Daily Stock price targets for KokusaiIndex TOK are 136.91 and 137.35 | Daily Target 1 | 136.57 | | Daily Target 2 | 136.8 | | Daily Target 3 | 137.01 | | Daily Target 4 | 137.24 | | Daily Target 5 | 137.45 |
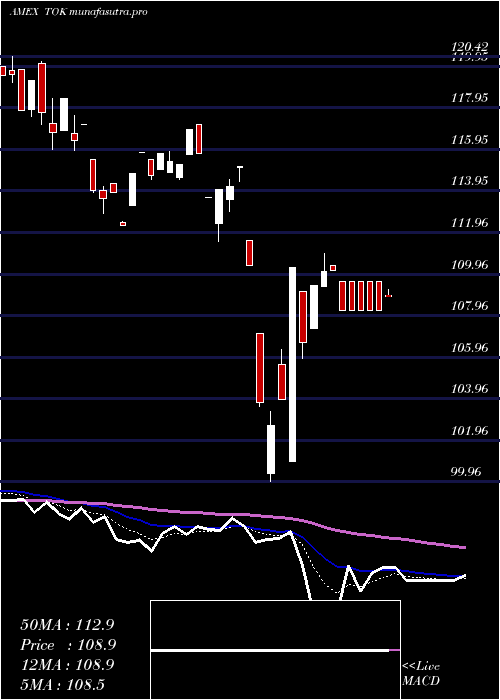
Daily price and volume Kokusai Index
| Date |
Closing |
Open |
Range |
Volume |
Fri 24 October 2025 |
137.03 (0.51%) |
136.78 |
136.78 - 137.22 |
1.0077 times |
Thu 23 October 2025 |
136.33 (0.66%) |
135.81 |
135.78 - 136.33 |
0.4791 times |
Wed 22 October 2025 |
135.43 (-0.45%) |
135.21 |
135.21 - 135.43 |
0.396 times |
Tue 21 October 2025 |
136.04 (0.16%) |
136.10 |
136.04 - 136.21 |
2.8745 times |
Mon 20 October 2025 |
135.82 (0.78%) |
135.18 |
135.18 - 135.82 |
0.7713 times |
Fri 17 October 2025 |
134.77 (0.39%) |
133.91 |
133.91 - 134.77 |
0.6388 times |
Thu 16 October 2025 |
134.24 (-0.35%) |
135.17 |
134.24 - 135.17 |
0.3194 times |
Wed 15 October 2025 |
134.71 (0.3%) |
134.99 |
134.71 - 134.99 |
0.6388 times |
Tue 14 October 2025 |
134.31 (-0.06%) |
133.34 |
133.34 - 134.90 |
1.1179 times |
Mon 13 October 2025 |
134.39 (-0.9%) |
133.68 |
133.68 - 134.39 |
1.7566 times |
Tue 07 October 2025 |
135.61 (-0.43%) |
135.61 |
135.61 - 135.61 |
0.1597 times |
Weekly price and charts KokusaiIndex Strong weekly Stock price targets for KokusaiIndex TOK are 136.11 and 138.15 | Weekly Target 1 | 134.44 | | Weekly Target 2 | 135.73 | | Weekly Target 3 | 136.47666666667 | | Weekly Target 4 | 137.77 | | Weekly Target 5 | 138.52 |
Weekly price and volumes for Kokusai Index
| Date |
Closing |
Open |
Range |
Volume |
Fri 24 October 2025 |
137.03 (1.68%) |
135.18 |
135.18 - 137.22 |
0.5118 times |
Fri 17 October 2025 |
134.77 (-0.62%) |
133.68 |
133.34 - 135.17 |
0.4139 times |
Tue 07 October 2025 |
135.61 (-0.23%) |
136.06 |
135.61 - 136.19 |
0.4751 times |
Fri 03 October 2025 |
135.92 (1.5%) |
134.31 |
134.14 - 136.34 |
0.8089 times |
Fri 26 September 2025 |
133.91 (-0.3%) |
134.31 |
132.93 - 134.96 |
0.9461 times |
Fri 19 September 2025 |
134.31 (0.93%) |
133.71 |
133.25 - 134.50 |
1.1826 times |
Fri 12 September 2025 |
133.07 (1.54%) |
131.21 |
131.21 - 133.21 |
1.3452 times |
Fri 05 September 2025 |
131.05 (0.31%) |
128.76 |
128.76 - 131.25 |
3.5182 times |
Fri 29 August 2025 |
130.64 (0%) |
130.64 |
130.64 - 130.64 |
0.0148 times |
Fri 29 August 2025 |
130.64 (-0.33%) |
130.76 |
130.16 - 131.39 |
0.7835 times |
Fri 22 August 2025 |
131.07 (0.53%) |
130.32 |
129.03 - 131.07 |
0.3991 times |

Monthly price and charts KokusaiIndex Strong monthly Stock price targets for KokusaiIndex TOK are 135.19 and 139.07 | Monthly Target 1 | 131.98 | | Monthly Target 2 | 134.51 | | Monthly Target 3 | 135.86333333333 | | Monthly Target 4 | 138.39 | | Monthly Target 5 | 139.74 |
Monthly price and volumes Kokusai Index
| Date |
Closing |
Open |
Range |
Volume |
Fri 24 October 2025 |
137.03 (1.53%) |
134.40 |
133.34 - 137.22 |
0.2685 times |
Tue 30 September 2025 |
134.97 (3.31%) |
128.76 |
128.76 - 134.97 |
0.9297 times |
Fri 29 August 2025 |
130.64 (2.65%) |
126.03 |
125.61 - 131.39 |
0.41 times |
Thu 31 July 2025 |
127.27 (1.03%) |
125.66 |
125.50 - 129.26 |
0.9969 times |
Mon 30 June 2025 |
125.97 (3.74%) |
120.88 |
120.88 - 125.97 |
0.3064 times |
Fri 30 May 2025 |
121.43 (6.16%) |
114.80 |
114.80 - 121.80 |
0.8251 times |
Wed 30 April 2025 |
114.38 (0.33%) |
113.53 |
99.96 - 115.13 |
2.6142 times |
Mon 31 March 2025 |
114.00 (-4.4%) |
120.07 |
111.53 - 120.19 |
2.0578 times |
Fri 28 February 2025 |
119.25 (-0.21%) |
117.27 |
117.27 - 122.55 |
0.6082 times |
Fri 31 January 2025 |
119.50 (2.99%) |
116.45 |
114.23 - 121.22 |
0.9832 times |
Tue 31 December 2024 |
116.03 (-3.24%) |
120.30 |
115.09 - 121.71 |
1.0824 times |

DMA SMA EMA moving averages of Kokusai Index TOK
DMA (daily moving average) of Kokusai Index TOK
| DMA period | DMA value | | 5 day DMA | 136.13 | | 12 day DMA | 135.41 | | 20 day DMA | 135.11 | | 35 day DMA | 134.14 | | 50 day DMA | 133.01 | | 100 day DMA | 129.32 | | 150 day DMA | 124.17 | | 200 day DMA | 122.76 | EMA (exponential moving average) of Kokusai Index TOK
| EMA period | EMA current | EMA prev | EMA prev2 | | 5 day EMA | 136.15 | 135.71 | 135.4 | | 12 day EMA | 135.57 | 135.3 | 135.11 | | 20 day EMA | 135.07 | 134.86 | 134.71 | | 35 day EMA | 134 | 133.82 | 133.67 | | 50 day EMA | 132.98 | 132.81 | 132.67 |
SMA (simple moving average) of Kokusai Index TOK
| SMA period | SMA current | SMA prev | SMA prev2 | | 5 day SMA | 136.13 | 135.68 | 135.26 | | 12 day SMA | 135.41 | 135.31 | 135.26 | | 20 day SMA | 135.11 | 134.97 | 134.9 | | 35 day SMA | 134.14 | 133.93 | 133.77 | | 50 day SMA | 133.01 | 132.87 | 132.72 | | 100 day SMA | 129.32 | 129.16 | 129.01 | | 150 day SMA | 124.17 | 124.03 | 123.89 | | 200 day SMA | 122.76 | 122.67 | 122.57 |
|
|
