20Year TMF full analysis,charts,indicators,moving averages,SMA,DMA,EMA,ADX,MACD,RSI20 Year TMF WideScreen charts, DMA,SMA,EMA technical analysis, forecast prediction, by indicators ADX,MACD,RSI,CCI AMEX stock exchange
Daily price and charts and targets 20Year Strong Daily Stock price targets for 20Year TMF are 42.37 and 43.45 | Daily Target 1 | 42.12 | | Daily Target 2 | 42.62 | | Daily Target 3 | 43.2 | | Daily Target 4 | 43.7 | | Daily Target 5 | 44.28 |
Daily price and volume 20 Year
| Date |
Closing |
Open |
Range |
Volume |
Fri 24 October 2025 |
43.12 (-0.12%) |
43.21 |
42.70 - 43.78 |
0.8377 times |
Thu 23 October 2025 |
43.17 (-2.15%) |
43.58 |
42.95 - 44.25 |
0.7443 times |
Wed 22 October 2025 |
44.12 (0.27%) |
43.97 |
43.73 - 44.22 |
0.8266 times |
Tue 21 October 2025 |
44.00 (1.55%) |
43.97 |
43.87 - 44.24 |
1.0281 times |
Mon 20 October 2025 |
43.33 (1.05%) |
42.56 |
42.42 - 43.37 |
0.6405 times |
Fri 17 October 2025 |
42.88 (-0.53%) |
42.96 |
42.47 - 42.99 |
1.1285 times |
Thu 16 October 2025 |
43.11 (2.16%) |
42.00 |
41.89 - 43.33 |
1.2392 times |
Wed 15 October 2025 |
42.20 (-0.61%) |
42.61 |
41.93 - 43.07 |
1.0585 times |
Tue 14 October 2025 |
42.46 (0.9%) |
42.22 |
41.88 - 42.55 |
1.2226 times |
Mon 13 October 2025 |
42.08 (4.55%) |
41.65 |
41.11 - 42.09 |
1.2741 times |
Tue 07 October 2025 |
40.25 (1.56%) |
39.99 |
39.79 - 40.55 |
0.9515 times |
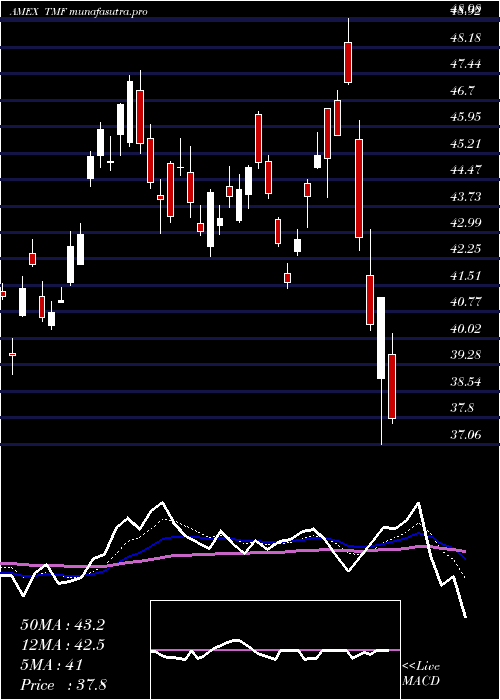
Weekly price and charts 20Year Strong weekly Stock price targets for 20Year TMF are 42.77 and 44.6 | Weekly Target 1 | 41.43 | | Weekly Target 2 | 42.28 | | Weekly Target 3 | 43.263333333333 | | Weekly Target 4 | 44.11 | | Weekly Target 5 | 45.09 |
Weekly price and volumes for 20 Year
| Date |
Closing |
Open |
Range |
Volume |
Fri 24 October 2025 |
43.12 (0.56%) |
42.56 |
42.42 - 44.25 |
0.7043 times |
Fri 17 October 2025 |
42.88 (6.53%) |
41.65 |
41.11 - 43.33 |
1.0232 times |
Tue 07 October 2025 |
40.25 (-0.64%) |
39.70 |
39.51 - 40.55 |
0.3581 times |
Fri 03 October 2025 |
40.51 (2.35%) |
40.14 |
40.01 - 41.26 |
0.8991 times |
Fri 26 September 2025 |
39.58 (-1.81%) |
39.98 |
39.08 - 40.38 |
0.9619 times |
Fri 19 September 2025 |
40.31 (-3.22%) |
41.91 |
39.97 - 43.10 |
1.361 times |
Fri 12 September 2025 |
41.65 (4.57%) |
40.68 |
40.41 - 42.41 |
1.463 times |
Fri 05 September 2025 |
39.83 (7.85%) |
36.14 |
35.97 - 39.91 |
1.4999 times |
Fri 29 August 2025 |
36.93 (0%) |
37.20 |
36.79 - 37.32 |
0.3045 times |
Fri 29 August 2025 |
36.93 (-1.86%) |
37.25 |
36.29 - 37.88 |
1.4251 times |
Fri 22 August 2025 |
37.63 (1.92%) |
37.03 |
36.40 - 37.98 |
1.2477 times |
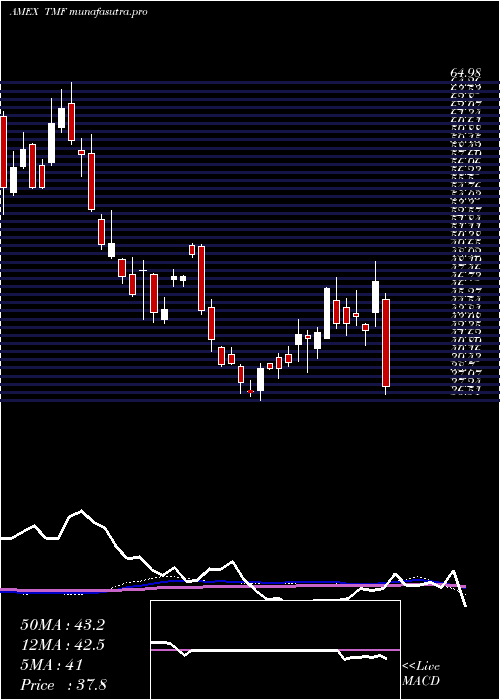
Monthly price and charts 20Year Strong monthly Stock price targets for 20Year TMF are 41.32 and 46.06 | Monthly Target 1 | 37.55 | | Monthly Target 2 | 40.34 | | Monthly Target 3 | 42.293333333333 | | Monthly Target 4 | 45.08 | | Monthly Target 5 | 47.03 |
Monthly price and volumes 20 Year
| Date |
Closing |
Open |
Range |
Volume |
Fri 24 October 2025 |
43.12 (7.32%) |
40.78 |
39.51 - 44.25 |
0.4498 times |
Tue 30 September 2025 |
40.18 (8.8%) |
36.14 |
35.97 - 43.10 |
0.9973 times |
Fri 29 August 2025 |
36.93 (-1.31%) |
38.63 |
36.29 - 39.78 |
0.9987 times |
Thu 31 July 2025 |
37.42 (-4.64%) |
39.52 |
34.24 - 39.75 |
1.1246 times |
Mon 30 June 2025 |
39.24 (6.23%) |
36.21 |
35.56 - 39.46 |
1.0457 times |
Fri 30 May 2025 |
36.94 (-11.2%) |
41.62 |
33.51 - 41.63 |
1.4086 times |
Wed 30 April 2025 |
41.60 (-5.45%) |
44.81 |
35.87 - 48.98 |
1.4459 times |
Mon 31 March 2025 |
44.00 (-5.54%) |
45.50 |
41.42 - 47.53 |
0.7718 times |
Fri 28 February 2025 |
46.58 (16.74%) |
41.50 |
39.01 - 46.60 |
0.7262 times |
Fri 31 January 2025 |
39.90 (-0.18%) |
40.56 |
36.51 - 41.36 |
1.0314 times |
Tue 31 December 2024 |
39.97 (-16.1%) |
50.38 |
39.58 - 50.58 |
0.8716 times |
DMA SMA EMA moving averages of 20 Year TMF
DMA (daily moving average) of 20 Year TMF
| DMA period | DMA value | | 5 day DMA | 43.55 | | 12 day DMA | 42.53 | | 20 day DMA | 41.6 | | 35 day DMA | 41.18 | | 50 day DMA | 40 | | 100 day DMA | 38.67 | | 150 day DMA | 39.09 | | 200 day DMA | 39.74 | EMA (exponential moving average) of 20 Year TMF
| EMA period | EMA current | EMA prev | EMA prev2 | | 5 day EMA | 43.28 | 43.36 | 43.46 | | 12 day EMA | 42.68 | 42.6 | 42.5 | | 20 day EMA | 42.05 | 41.94 | 41.81 | | 35 day EMA | 41.05 | 40.93 | 40.8 | | 50 day EMA | 40.22 | 40.1 | 39.97 |
SMA (simple moving average) of 20 Year TMF
| SMA period | SMA current | SMA prev | SMA prev2 | | 5 day SMA | 43.55 | 43.5 | 43.49 | | 12 day SMA | 42.53 | 42.31 | 42.12 | | 20 day SMA | 41.6 | 41.45 | 41.29 | | 35 day SMA | 41.18 | 40.98 | 40.8 | | 50 day SMA | 40 | 39.89 | 39.79 | | 100 day SMA | 38.67 | 38.6 | 38.53 | | 150 day SMA | 39.09 | 39.1 | 39.11 | | 200 day SMA | 39.74 | 39.72 | 39.7 |
|
|
