1020 TLH full analysis,charts,indicators,moving averages,SMA,DMA,EMA,ADX,MACD,RSI10 20 TLH WideScreen charts, DMA,SMA,EMA technical analysis, forecast prediction, by indicators ADX,MACD,RSI,CCI AMEX stock exchange
Daily price and charts and targets 1020 Strong Daily Stock price targets for 1020 TLH are 104.55 and 104.94 | Daily Target 1 | 104.47 | | Daily Target 2 | 104.63 | | Daily Target 3 | 104.85666666667 | | Daily Target 4 | 105.02 | | Daily Target 5 | 105.25 |
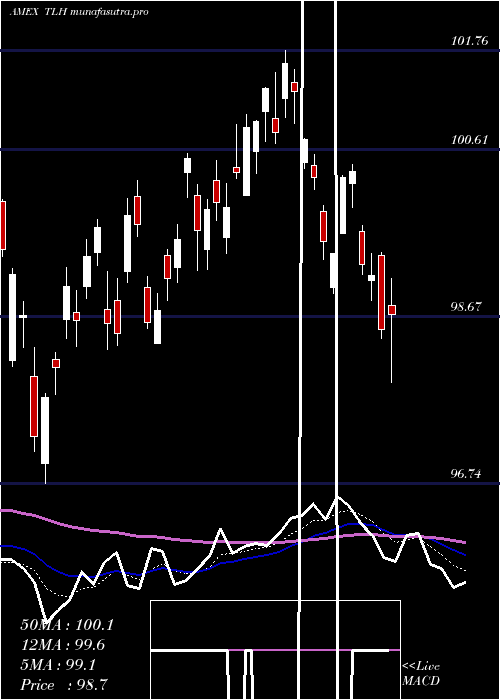
Daily price and volume 10 20
| Date |
Closing |
Open |
Range |
Volume |
Thu 23 October 2025 |
104.80 (-0.52%) |
104.96 |
104.69 - 105.08 |
0.6459 times |
Wed 22 October 2025 |
105.35 (0.07%) |
105.27 |
105.12 - 105.44 |
0.6847 times |
Tue 21 October 2025 |
105.28 (0.38%) |
105.30 |
105.18 - 105.47 |
1.8832 times |
Mon 20 October 2025 |
104.88 (0.3%) |
104.48 |
104.08 - 104.91 |
0.4296 times |
Fri 17 October 2025 |
104.57 (-0.19%) |
104.66 |
104.32 - 104.66 |
0.6158 times |
Thu 16 October 2025 |
104.77 (0.66%) |
104.35 |
103.91 - 104.89 |
0.9076 times |
Wed 15 October 2025 |
104.08 (-0.27%) |
104.43 |
103.93 - 104.72 |
1.7357 times |
Tue 14 October 2025 |
104.36 (0.35%) |
104.15 |
103.95 - 104.39 |
1.1852 times |
Mon 13 October 2025 |
104.00 (-0.05%) |
103.79 |
103.40 - 104.00 |
0.5646 times |
Fri 10 October 2025 |
104.05 (1.19%) |
103.56 |
103.46 - 104.18 |
1.3476 times |
Thu 09 October 2025 |
102.83 (-0.07%) |
102.81 |
102.68 - 102.93 |
0.6448 times |
Weekly price and charts 1020 Strong weekly Stock price targets for 1020 TLH are 104.44 and 105.83 | Weekly Target 1 | 103.39 | | Weekly Target 2 | 104.1 | | Weekly Target 3 | 104.78333333333 | | Weekly Target 4 | 105.49 | | Weekly Target 5 | 106.17 |
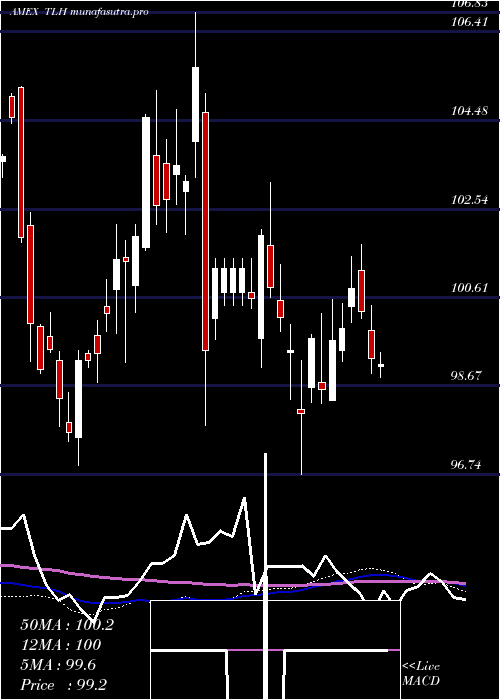
Weekly price and volumes for 10 20
| Date |
Closing |
Open |
Range |
Volume |
Thu 23 October 2025 |
104.80 (0.22%) |
104.48 |
104.08 - 105.47 |
0.7127 times |
Fri 17 October 2025 |
104.57 (0.5%) |
103.79 |
103.40 - 104.89 |
0.9799 times |
Fri 10 October 2025 |
104.05 (1.04%) |
102.63 |
102.35 - 104.18 |
0.8917 times |
Fri 03 October 2025 |
102.98 (0.44%) |
102.85 |
102.77 - 104.50 |
1.0086 times |
Fri 26 September 2025 |
102.53 (-0.24%) |
102.68 |
102.19 - 103.08 |
0.951 times |
Fri 19 September 2025 |
102.78 (-0.69%) |
103.75 |
102.56 - 104.61 |
3.3918 times |
Fri 12 September 2025 |
103.49 (0.92%) |
103.08 |
102.88 - 104.14 |
0.6568 times |
Fri 05 September 2025 |
102.55 (1.62%) |
99.84 |
99.77 - 102.68 |
0.5668 times |
Fri 29 August 2025 |
100.92 (0%) |
100.95 |
100.68 - 101.06 |
0.123 times |
Fri 29 August 2025 |
100.92 (-0.04%) |
100.64 |
100.19 - 101.38 |
0.7177 times |
Fri 22 August 2025 |
100.96 (0.73%) |
100.34 |
99.84 - 101.16 |
0.8733 times |
Monthly price and charts 1020 Strong monthly Stock price targets for 1020 TLH are 103.58 and 106.7 | Monthly Target 1 | 101.09 | | Monthly Target 2 | 102.94 | | Monthly Target 3 | 104.20666666667 | | Monthly Target 4 | 106.06 | | Monthly Target 5 | 107.33 |
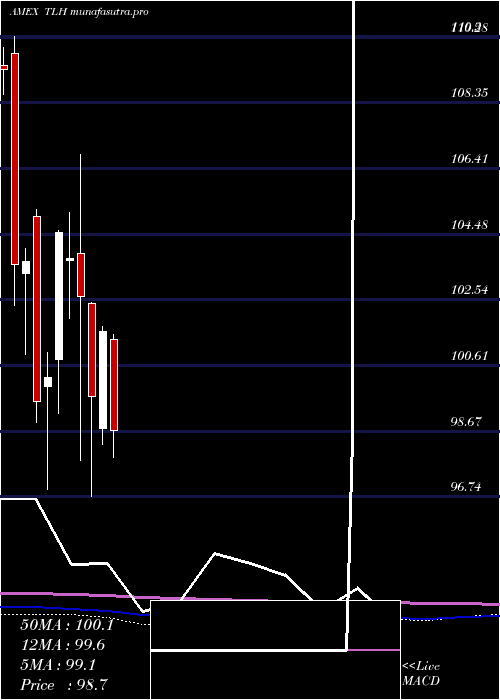
Monthly price and volumes 10 20
| Date |
Closing |
Open |
Range |
Volume |
Thu 23 October 2025 |
104.80 (1.76%) |
103.12 |
102.35 - 105.47 |
0.6375 times |
Tue 30 September 2025 |
102.99 (2.05%) |
99.84 |
99.77 - 104.61 |
1.167 times |
Fri 29 August 2025 |
100.92 (0.43%) |
101.15 |
99.84 - 102.02 |
0.8019 times |
Thu 31 July 2025 |
100.49 (-1.09%) |
101.38 |
97.91 - 101.53 |
1.0405 times |
Mon 30 June 2025 |
101.60 (1.91%) |
98.76 |
98.29 - 101.76 |
0.9928 times |
Fri 30 May 2025 |
99.70 (-2.86%) |
102.42 |
96.74 - 102.45 |
1.6096 times |
Wed 30 April 2025 |
102.64 (-1.07%) |
103.91 |
97.82 - 106.83 |
0.9281 times |
Mon 31 March 2025 |
103.75 (-0.75%) |
103.71 |
101.99 - 105.12 |
0.7883 times |
Fri 28 February 2025 |
104.53 (4.26%) |
100.78 |
99.20 - 104.60 |
1.3242 times |
Fri 31 January 2025 |
100.26 (0.72%) |
99.98 |
96.95 - 100.99 |
0.7102 times |
Tue 31 December 2024 |
99.54 (-3.99%) |
104.99 |
98.94 - 105.22 |
0.5989 times |
DMA SMA EMA moving averages of 10 20 TLH
DMA (daily moving average) of 10 20 TLH
| DMA period | DMA value | | 5 day DMA | 104.98 | | 12 day DMA | 104.32 | | 20 day DMA | 103.74 | | 35 day DMA | 103.51 | | 50 day DMA | 102.66 | | 100 day DMA | 101.38 | | 150 day DMA | 101.21 | | 200 day DMA | 101.23 | EMA (exponential moving average) of 10 20 TLH
| EMA period | EMA current | EMA prev | EMA prev2 | | 5 day EMA | 104.91 | 104.96 | 104.76 | | 12 day EMA | 104.43 | 104.36 | 104.18 | | 20 day EMA | 104 | 103.92 | 103.77 | | 35 day EMA | 103.32 | 103.23 | 103.11 | | 50 day EMA | 102.75 | 102.67 | 102.56 |
SMA (simple moving average) of 10 20 TLH
| SMA period | SMA current | SMA prev | SMA prev2 | | 5 day SMA | 104.98 | 104.97 | 104.72 | | 12 day SMA | 104.32 | 104.16 | 103.91 | | 20 day SMA | 103.74 | 103.64 | 103.51 | | 35 day SMA | 103.51 | 103.41 | 103.28 | | 50 day SMA | 102.66 | 102.58 | 102.5 | | 100 day SMA | 101.38 | 101.33 | 101.27 | | 150 day SMA | 101.21 | 101.21 | 101.2 | | 200 day SMA | 101.23 | 101.2 | 101.17 |
|
|
