RoboGlobal THNQ full analysis,charts,indicators,moving averages,SMA,DMA,EMA,ADX,MACD,RSIRobo Global THNQ WideScreen charts, DMA,SMA,EMA technical analysis, forecast prediction, by indicators ADX,MACD,RSI,CCI AMEX stock exchange
Daily price and charts and targets RoboGlobal Strong Daily Stock price targets for RoboGlobal THNQ are 66.78 and 67.64 | Daily Target 1 | 66.14 | | Daily Target 2 | 66.55 | | Daily Target 3 | 67 | | Daily Target 4 | 67.41 | | Daily Target 5 | 67.86 |
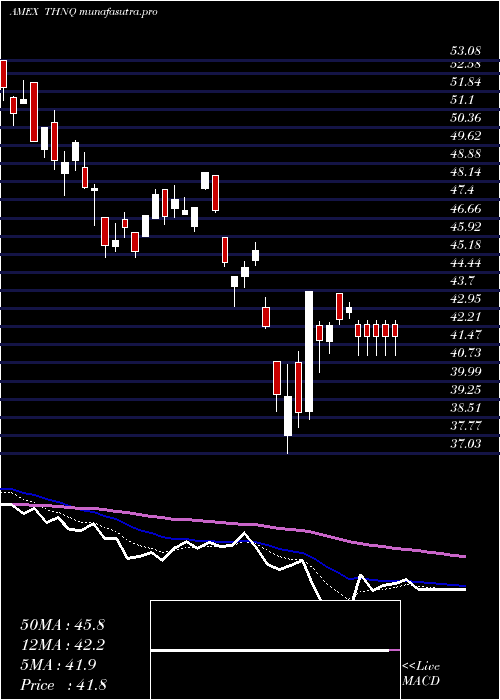
Daily price and volume Robo Global
| Date |
Closing |
Open |
Range |
Volume |
Fri 24 October 2025 |
66.96 (1.15%) |
66.83 |
66.59 - 67.45 |
0.6419 times |
Thu 23 October 2025 |
66.20 (2.29%) |
64.79 |
64.79 - 66.20 |
0.566 times |
Wed 22 October 2025 |
64.72 (-1.73%) |
65.81 |
63.81 - 65.81 |
0.8967 times |
Tue 21 October 2025 |
65.86 (0.12%) |
65.90 |
65.46 - 66.34 |
1.5047 times |
Mon 20 October 2025 |
65.78 (1.58%) |
65.58 |
65.08 - 66.17 |
0.9818 times |
Fri 17 October 2025 |
64.76 (-0.58%) |
64.39 |
64.21 - 65.14 |
1.0798 times |
Thu 16 October 2025 |
65.14 (-0.87%) |
66.45 |
64.88 - 66.51 |
1.2647 times |
Wed 15 October 2025 |
65.71 (0.77%) |
65.97 |
65.17 - 66.43 |
0.8248 times |
Tue 14 October 2025 |
65.21 (-2.04%) |
65.01 |
64.29 - 65.89 |
1.1947 times |
Mon 13 October 2025 |
66.57 (0.67%) |
66.30 |
65.81 - 66.66 |
1.0448 times |
Tue 07 October 2025 |
66.13 (-2.13%) |
68.12 |
65.80 - 68.12 |
1.7796 times |
Weekly price and charts RoboGlobal Strong weekly Stock price targets for RoboGlobal THNQ are 65.39 and 69.03 | Weekly Target 1 | 62.43 | | Weekly Target 2 | 64.7 | | Weekly Target 3 | 66.073333333333 | | Weekly Target 4 | 68.34 | | Weekly Target 5 | 69.71 |
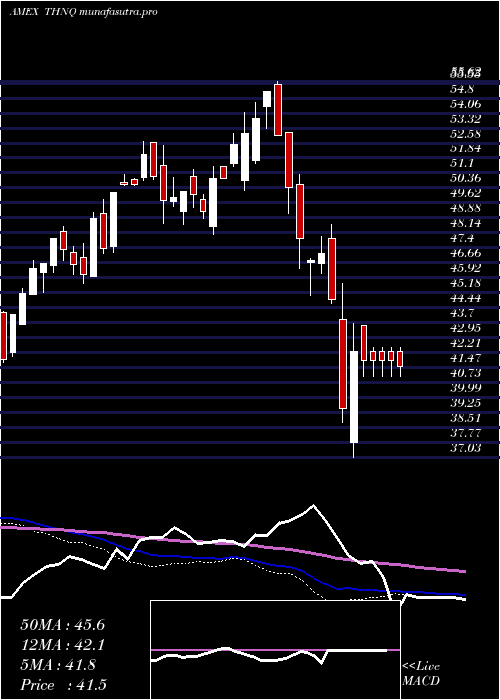
Weekly price and volumes for Robo Global
| Date |
Closing |
Open |
Range |
Volume |
Fri 24 October 2025 |
66.96 (3.4%) |
65.58 |
63.81 - 67.45 |
0.7897 times |
Fri 17 October 2025 |
64.76 (-2.07%) |
66.30 |
64.21 - 66.66 |
0.9304 times |
Tue 07 October 2025 |
66.13 (-0.65%) |
67.45 |
65.80 - 68.30 |
0.5751 times |
Fri 03 October 2025 |
66.56 (4.16%) |
64.95 |
63.69 - 67.28 |
1.4786 times |
Fri 26 September 2025 |
63.90 (-1.8%) |
65.15 |
62.61 - 66.10 |
1.2605 times |
Fri 19 September 2025 |
65.07 (4.82%) |
62.55 |
62.44 - 65.09 |
1.0284 times |
Fri 12 September 2025 |
62.08 (3.93%) |
59.97 |
59.97 - 62.77 |
1.3474 times |
Fri 05 September 2025 |
59.73 (0.81%) |
58.08 |
57.52 - 60.00 |
0.675 times |
Fri 29 August 2025 |
59.25 (0%) |
59.36 |
59.00 - 59.39 |
0.1135 times |
Fri 29 August 2025 |
59.25 (2.7%) |
57.61 |
57.33 - 59.80 |
1.8014 times |
Fri 22 August 2025 |
57.69 (0.65%) |
57.46 |
54.84 - 57.87 |
1.2184 times |
Monthly price and charts RoboGlobal Strong monthly Stock price targets for RoboGlobal THNQ are 65.33 and 69.94 | Monthly Target 1 | 61.71 | | Monthly Target 2 | 64.33 | | Monthly Target 3 | 66.316666666667 | | Monthly Target 4 | 68.94 | | Monthly Target 5 | 70.93 |
Monthly price and volumes Robo Global
| Date |
Closing |
Open |
Range |
Volume |
Fri 24 October 2025 |
66.96 (4.56%) |
63.69 |
63.69 - 68.30 |
0.7682 times |
Tue 30 September 2025 |
64.04 (8.08%) |
58.08 |
57.52 - 66.10 |
1.0476 times |
Fri 29 August 2025 |
59.25 (5.58%) |
55.00 |
53.86 - 59.80 |
1.3236 times |
Thu 31 July 2025 |
56.12 (2.04%) |
54.99 |
53.63 - 57.23 |
1.0881 times |
Mon 30 June 2025 |
55.00 (9.65%) |
50.03 |
49.84 - 55.00 |
0.7221 times |
Fri 30 May 2025 |
50.16 (11.54%) |
45.63 |
45.25 - 51.96 |
0.5788 times |
Wed 30 April 2025 |
44.97 (1.63%) |
44.28 |
37.03 - 45.65 |
1.1063 times |
Mon 31 March 2025 |
44.25 (-12.15%) |
50.55 |
43.06 - 51.04 |
0.8933 times |
Fri 28 February 2025 |
50.37 (-5.02%) |
51.74 |
49.12 - 55.62 |
1.0082 times |
Fri 31 January 2025 |
53.03 (8.22%) |
49.35 |
48.08 - 54.07 |
1.4638 times |
Tue 31 December 2024 |
49.00 (-2.99%) |
50.86 |
48.56 - 52.67 |
0.422 times |

DMA SMA EMA moving averages of Robo Global THNQ
DMA (daily moving average) of Robo Global THNQ
| DMA period | DMA value | | 5 day DMA | 65.9 | | 12 day DMA | 65.88 | | 20 day DMA | 65.49 | | 35 day DMA | 64.16 | | 50 day DMA | 62.23 | | 100 day DMA | 58.17 | | 150 day DMA | 53.99 | | 200 day DMA | 53.25 | EMA (exponential moving average) of Robo Global THNQ
| EMA period | EMA current | EMA prev | EMA prev2 | | 5 day EMA | 66.06 | 65.61 | 65.31 | | 12 day EMA | 65.72 | 65.49 | 65.36 | | 20 day EMA | 65.2 | 65.01 | 64.89 | | 35 day EMA | 63.7 | 63.51 | 63.35 | | 50 day EMA | 62.11 | 61.91 | 61.73 |
SMA (simple moving average) of Robo Global THNQ
| SMA period | SMA current | SMA prev | SMA prev2 | | 5 day SMA | 65.9 | 65.46 | 65.25 | | 12 day SMA | 65.88 | 65.85 | 65.89 | | 20 day SMA | 65.49 | 65.39 | 65.36 | | 35 day SMA | 64.16 | 63.92 | 63.72 | | 50 day SMA | 62.23 | 62.03 | 61.82 | | 100 day SMA | 58.17 | 58.01 | 57.86 | | 150 day SMA | 53.99 | 53.85 | 53.73 | | 200 day SMA | 53.25 | 53.17 | 53.09 |
|
|
