InternationalTower THM full analysis,charts,indicators,moving averages,SMA,DMA,EMA,ADX,MACD,RSIInternational Tower THM WideScreen charts, DMA,SMA,EMA technical analysis, forecast prediction, by indicators ADX,MACD,RSI,CCI AMEX stock exchange
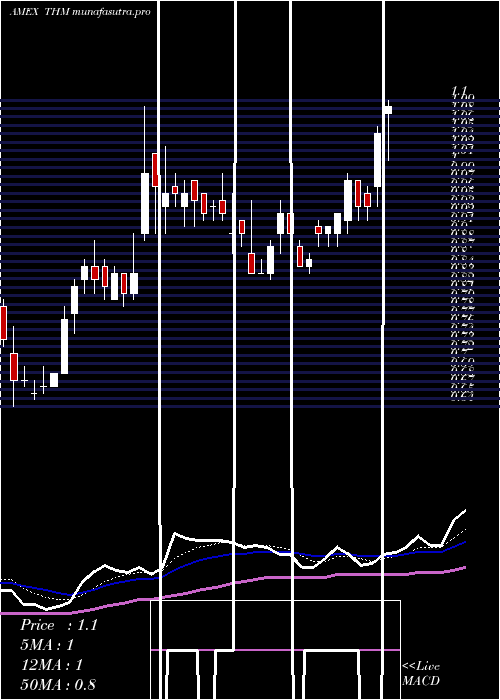
Daily price and charts and targets InternationalTower Strong Daily Stock price targets for InternationalTower THM are 1.74 and 1.9 | Daily Target 1 | 1.7 | | Daily Target 2 | 1.77 | | Daily Target 3 | 1.8633333333333 | | Daily Target 4 | 1.93 | | Daily Target 5 | 2.02 |
Daily price and volume International Tower
| Date |
Closing |
Open |
Range |
Volume |
Fri 24 October 2025 |
1.83 (-3.68%) |
1.87 |
1.80 - 1.96 |
0.306 times |
Thu 23 October 2025 |
1.90 (0.53%) |
1.94 |
1.83 - 1.99 |
0.3163 times |
Wed 22 October 2025 |
1.89 (3.28%) |
1.86 |
1.68 - 1.97 |
0.4794 times |
Tue 21 October 2025 |
1.83 (-14.08%) |
1.95 |
1.80 - 2.00 |
0.8088 times |
Mon 20 October 2025 |
2.13 (6.5%) |
2.11 |
2.06 - 2.31 |
0.4461 times |
Fri 17 October 2025 |
2.00 (-10.71%) |
2.22 |
1.99 - 2.25 |
0.8277 times |
Thu 16 October 2025 |
2.24 (-16.1%) |
2.69 |
2.20 - 2.74 |
1.3483 times |
Wed 15 October 2025 |
2.67 (-3.26%) |
3.02 |
2.48 - 3.13 |
1.94 times |
Tue 14 October 2025 |
2.76 (34.63%) |
2.08 |
2.04 - 2.85 |
2.9629 times |
Mon 13 October 2025 |
2.05 (9.63%) |
2.06 |
1.97 - 2.13 |
0.5645 times |
Tue 07 October 2025 |
1.87 (2.75%) |
1.90 |
1.73 - 1.91 |
0.5081 times |
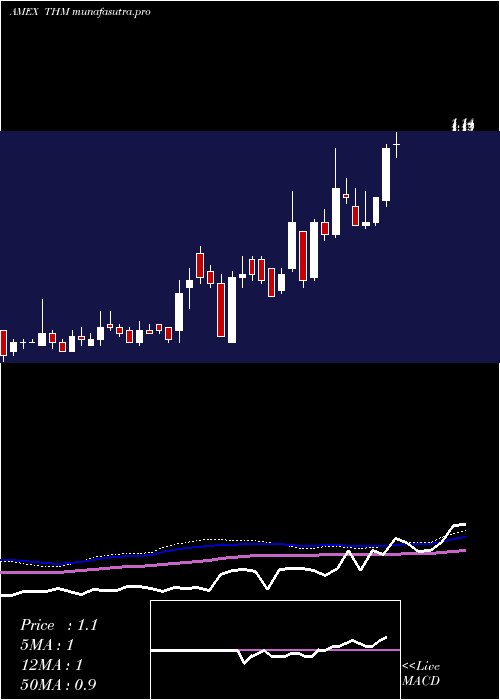
Weekly price and charts InternationalTower Strong weekly Stock price targets for InternationalTower THM are 1.44 and 2.07 | Weekly Target 1 | 1.31 | | Weekly Target 2 | 1.57 | | Weekly Target 3 | 1.94 | | Weekly Target 4 | 2.2 | | Weekly Target 5 | 2.57 |
Weekly price and volumes for International Tower
| Date |
Closing |
Open |
Range |
Volume |
Fri 24 October 2025 |
1.83 (-8.5%) |
2.11 |
1.68 - 2.31 |
1.2278 times |
Fri 17 October 2025 |
2.00 (6.95%) |
2.06 |
1.97 - 3.13 |
3.982 times |
Tue 07 October 2025 |
1.87 (0%) |
1.97 |
1.73 - 2.05 |
0.503 times |
Fri 03 October 2025 |
1.87 (20.65%) |
1.66 |
1.58 - 1.90 |
1.0261 times |
Fri 26 September 2025 |
1.55 (-3.13%) |
1.64 |
1.46 - 1.73 |
0.6735 times |
Fri 19 September 2025 |
1.60 (0.63%) |
1.60 |
1.42 - 1.66 |
0.6492 times |
Fri 12 September 2025 |
1.59 (12.77%) |
1.49 |
1.41 - 1.62 |
0.5745 times |
Fri 05 September 2025 |
1.41 (0.71%) |
1.45 |
1.39 - 1.67 |
0.8364 times |
Fri 29 August 2025 |
1.40 (0%) |
1.35 |
1.33 - 1.43 |
0.0863 times |
Fri 29 August 2025 |
1.40 (-0.71%) |
1.41 |
1.30 - 1.46 |
0.4413 times |
Fri 22 August 2025 |
1.41 (17.5%) |
1.23 |
1.13 - 1.45 |
0.6639 times |
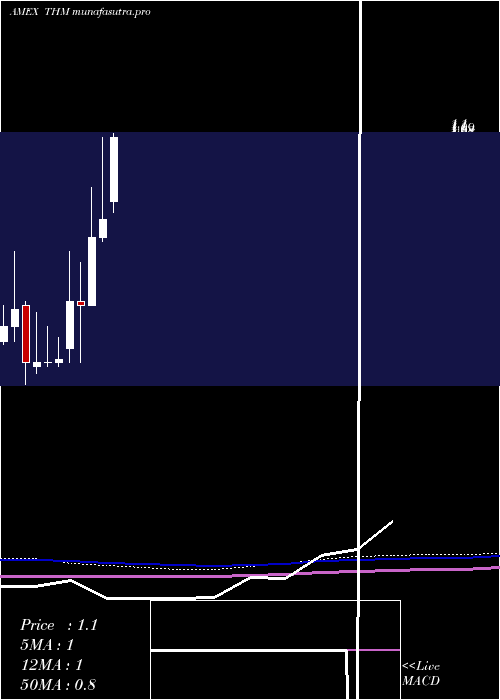
Monthly price and charts InternationalTower Strong monthly Stock price targets for InternationalTower THM are 1.73 and 3.24 | Monthly Target 1 | 0.68 | | Monthly Target 2 | 1.26 | | Monthly Target 3 | 2.1933333333333 | | Monthly Target 4 | 2.77 | | Monthly Target 5 | 3.7 |
Monthly price and volumes International Tower
| Date |
Closing |
Open |
Range |
Volume |
Fri 24 October 2025 |
1.83 (11.59%) |
1.65 |
1.62 - 3.13 |
2.6014 times |
Tue 30 September 2025 |
1.64 (17.14%) |
1.45 |
1.39 - 1.73 |
1.2547 times |
Fri 29 August 2025 |
1.40 (22.81%) |
1.15 |
1.10 - 1.49 |
1.0377 times |
Thu 31 July 2025 |
1.14 (32.56%) |
0.91 |
0.88 - 1.20 |
0.7962 times |
Mon 30 June 2025 |
0.86 (6.17%) |
0.81 |
0.80 - 1.09 |
0.6724 times |
Fri 30 May 2025 |
0.81 (30.65%) |
0.62 |
0.62 - 0.95 |
1.2667 times |
Wed 30 April 2025 |
0.62 (-1.59%) |
0.63 |
0.46 - 0.74 |
0.7707 times |
Mon 31 March 2025 |
0.63 (34.04%) |
0.50 |
0.46 - 0.77 |
0.8268 times |
Fri 28 February 2025 |
0.47 (2.17%) |
0.46 |
0.45 - 0.53 |
0.3321 times |
Fri 31 January 2025 |
0.46 (0%) |
0.46 |
0.45 - 0.56 |
0.4413 times |
Tue 31 December 2024 |
0.46 (0%) |
0.45 |
0.43 - 0.60 |
0.4694 times |
DMA SMA EMA moving averages of International Tower THM
DMA (daily moving average) of International Tower THM
| DMA period | DMA value | | 5 day DMA | 1.92 | | 12 day DMA | 2.08 | | 20 day DMA | 1.91 | | 35 day DMA | 1.75 | | 50 day DMA | 1.63 | | 100 day DMA | 1.32 | | 150 day DMA | 1.11 | | 200 day DMA | 0.96 | EMA (exponential moving average) of International Tower THM
| EMA period | EMA current | EMA prev | EMA prev2 | | 5 day EMA | 1.92 | 1.97 | 2 | | 12 day EMA | 1.96 | 1.98 | 2 | | 20 day EMA | 1.91 | 1.92 | 1.92 | | 35 day EMA | 1.8 | 1.8 | 1.79 | | 50 day EMA | 1.63 | 1.62 | 1.61 |
SMA (simple moving average) of International Tower THM
| SMA period | SMA current | SMA prev | SMA prev2 | | 5 day SMA | 1.92 | 1.95 | 2.02 | | 12 day SMA | 2.08 | 2.09 | 2.07 | | 20 day SMA | 1.91 | 1.89 | 1.88 | | 35 day SMA | 1.75 | 1.75 | 1.73 | | 50 day SMA | 1.63 | 1.62 | 1.6 | | 100 day SMA | 1.32 | 1.31 | 1.3 | | 150 day SMA | 1.11 | 1.1 | 1.09 | | 200 day SMA | 0.96 | 0.95 | 0.95 |
|
|
