TasekoMines TGB full analysis,charts,indicators,moving averages,SMA,DMA,EMA,ADX,MACD,RSITaseko Mines TGB WideScreen charts, DMA,SMA,EMA technical analysis, forecast prediction, by indicators ADX,MACD,RSI,CCI AMEX stock exchange
Daily price and charts and targets TasekoMines Strong Daily Stock price targets for TasekoMines TGB are 3.94 and 4.11 | Daily Target 1 | 3.9 | | Daily Target 2 | 3.97 | | Daily Target 3 | 4.0666666666667 | | Daily Target 4 | 4.14 | | Daily Target 5 | 4.24 |
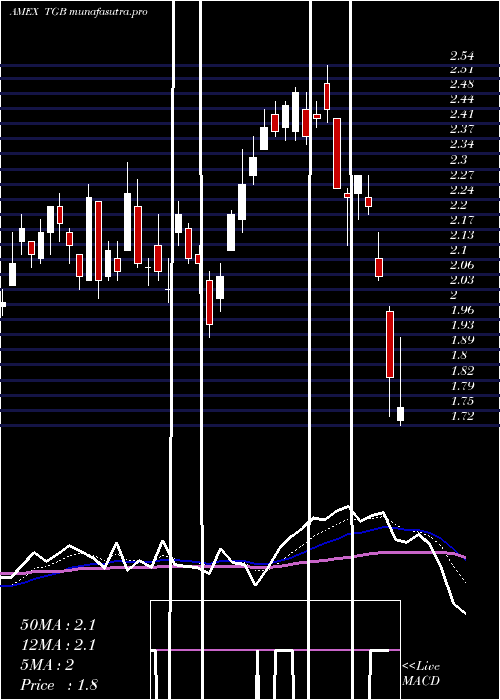
Daily price and volume Taseko Mines
| Date |
Closing |
Open |
Range |
Volume |
Fri 24 October 2025 |
4.05 (-0.49%) |
4.09 |
3.99 - 4.16 |
0.6637 times |
Thu 23 October 2025 |
4.07 (4.63%) |
4.03 |
3.94 - 4.18 |
1.3304 times |
Wed 22 October 2025 |
3.89 (3.73%) |
3.80 |
3.65 - 3.92 |
1.1467 times |
Tue 21 October 2025 |
3.75 (-5.78%) |
3.85 |
3.70 - 3.87 |
0.9738 times |
Mon 20 October 2025 |
3.98 (2.84%) |
3.99 |
3.86 - 4.00 |
0.5483 times |
Fri 17 October 2025 |
3.87 (-4.44%) |
3.98 |
3.80 - 4.00 |
1.0772 times |
Thu 16 October 2025 |
4.05 (-6.25%) |
4.22 |
3.96 - 4.22 |
2.1237 times |
Wed 15 October 2025 |
4.32 (-1.59%) |
4.51 |
4.21 - 4.54 |
0.8516 times |
Tue 14 October 2025 |
4.39 (-6%) |
4.51 |
4.35 - 4.55 |
0.6061 times |
Mon 13 October 2025 |
4.67 (5.9%) |
4.60 |
4.50 - 4.72 |
0.6786 times |
Fri 10 October 2025 |
4.41 (-1.12%) |
4.49 |
4.35 - 4.56 |
1.0942 times |
Weekly price and charts TasekoMines Strong weekly Stock price targets for TasekoMines TGB are 3.85 and 4.38 | Weekly Target 1 | 3.43 | | Weekly Target 2 | 3.74 | | Weekly Target 3 | 3.96 | | Weekly Target 4 | 4.27 | | Weekly Target 5 | 4.49 |
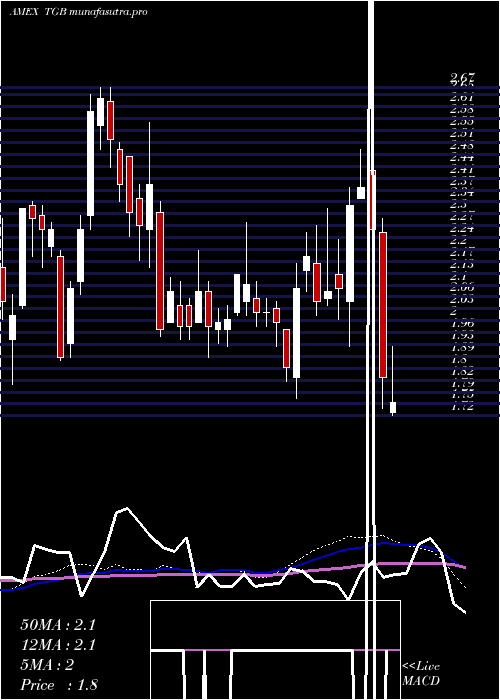
Weekly price and volumes for Taseko Mines
| Date |
Closing |
Open |
Range |
Volume |
Fri 24 October 2025 |
4.05 (4.65%) |
3.99 |
3.65 - 4.18 |
1.5519 times |
Fri 17 October 2025 |
3.87 (-12.24%) |
4.60 |
3.80 - 4.72 |
1.7764 times |
Fri 10 October 2025 |
4.41 (6.01%) |
4.18 |
4.08 - 4.84 |
1.388 times |
Fri 03 October 2025 |
4.16 (2.72%) |
4.12 |
4.06 - 4.32 |
1.2348 times |
Fri 26 September 2025 |
4.05 (7.71%) |
3.76 |
3.71 - 4.21 |
1.2419 times |
Fri 19 September 2025 |
3.76 (5.92%) |
3.56 |
3.53 - 3.77 |
0.874 times |
Fri 12 September 2025 |
3.55 (6.61%) |
3.37 |
3.35 - 3.59 |
0.6195 times |
Fri 05 September 2025 |
3.33 (2.15%) |
3.23 |
3.14 - 3.46 |
0.665 times |
Fri 29 August 2025 |
3.26 (0%) |
3.20 |
3.18 - 3.27 |
0.1069 times |
Fri 29 August 2025 |
3.26 (2.84%) |
3.15 |
3.12 - 3.27 |
0.5416 times |
Fri 22 August 2025 |
3.17 (-3.06%) |
3.26 |
3.01 - 3.30 |
0.9477 times |
Monthly price and charts TasekoMines Strong monthly Stock price targets for TasekoMines TGB are 3.26 and 4.45 | Monthly Target 1 | 2.99 | | Monthly Target 2 | 3.52 | | Monthly Target 3 | 4.18 | | Monthly Target 4 | 4.71 | | Monthly Target 5 | 5.37 |
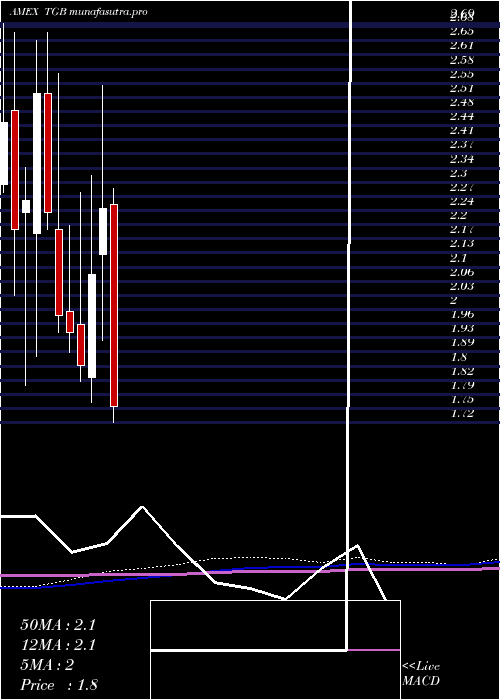
Monthly price and volumes Taseko Mines
| Date |
Closing |
Open |
Range |
Volume |
Fri 24 October 2025 |
4.05 (-4.26%) |
4.25 |
3.65 - 4.84 |
0.6285 times |
Tue 30 September 2025 |
4.23 (29.75%) |
3.23 |
3.14 - 4.32 |
0.456 times |
Fri 29 August 2025 |
3.26 (6.19%) |
3.02 |
2.99 - 3.51 |
0.4234 times |
Thu 31 July 2025 |
3.07 (-2.54%) |
3.20 |
2.96 - 3.68 |
0.9653 times |
Mon 30 June 2025 |
3.15 (41.26%) |
2.29 |
2.29 - 3.17 |
1.6969 times |
Fri 30 May 2025 |
2.23 (-2.19%) |
2.27 |
1.89 - 2.31 |
1.0833 times |
Wed 30 April 2025 |
2.28 (1.79%) |
2.25 |
1.67 - 2.39 |
1.9505 times |
Mon 31 March 2025 |
2.24 (7.69%) |
2.13 |
1.92 - 2.54 |
1.6132 times |
Fri 28 February 2025 |
2.08 (11.83%) |
1.83 |
1.77 - 2.32 |
0.6575 times |
Fri 31 January 2025 |
1.86 (-4.12%) |
1.96 |
1.82 - 2.28 |
0.5255 times |
Tue 31 December 2024 |
1.94 (-2.02%) |
1.99 |
1.89 - 2.20 |
0.2335 times |
DMA SMA EMA moving averages of Taseko Mines TGB
DMA (daily moving average) of Taseko Mines TGB
| DMA period | DMA value | | 5 day DMA | 3.95 | | 12 day DMA | 4.16 | | 20 day DMA | 4.18 | | 35 day DMA | 3.97 | | 50 day DMA | 3.75 | | 100 day DMA | 3.45 | | 150 day DMA | 3 | | 200 day DMA | 2.78 | EMA (exponential moving average) of Taseko Mines TGB
| EMA period | EMA current | EMA prev | EMA prev2 | | 5 day EMA | 4.01 | 3.99 | 3.95 | | 12 day EMA | 4.07 | 4.07 | 4.07 | | 20 day EMA | 4.06 | 4.06 | 4.06 | | 35 day EMA | 3.92 | 3.91 | 3.9 | | 50 day EMA | 3.72 | 3.71 | 3.7 |
SMA (simple moving average) of Taseko Mines TGB
| SMA period | SMA current | SMA prev | SMA prev2 | | 5 day SMA | 3.95 | 3.91 | 3.91 | | 12 day SMA | 4.16 | 4.19 | 4.2 | | 20 day SMA | 4.18 | 4.18 | 4.18 | | 35 day SMA | 3.97 | 3.95 | 3.93 | | 50 day SMA | 3.75 | 3.73 | 3.71 | | 100 day SMA | 3.45 | 3.44 | 3.42 | | 150 day SMA | 3 | 2.99 | 2.98 | | 200 day SMA | 2.78 | 2.77 | 2.76 |
|
|
