TechnologyBull TECL full analysis,charts,indicators,moving averages,SMA,DMA,EMA,ADX,MACD,RSITechnology Bull TECL WideScreen charts, DMA,SMA,EMA technical analysis, forecast prediction, by indicators ADX,MACD,RSI,CCI AMEX stock exchange
Daily price and charts and targets TechnologyBull Strong Daily Stock price targets for TechnologyBull TECL are 127.93 and 136 | Daily Target 1 | 121.3 | | Daily Target 2 | 126.48 | | Daily Target 3 | 129.37333333333 | | Daily Target 4 | 134.55 | | Daily Target 5 | 137.44 |
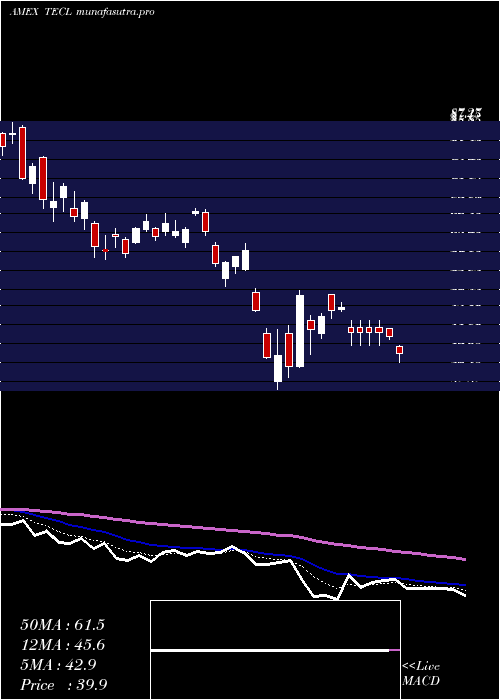
Daily price and volume Technology Bull
| Date |
Closing |
Open |
Range |
Volume |
Thu 23 October 2025 |
131.65 (3.67%) |
126.69 |
124.20 - 132.27 |
0.7295 times |
Wed 22 October 2025 |
126.99 (-3.08%) |
130.61 |
122.09 - 131.37 |
1.1577 times |
Tue 21 October 2025 |
131.02 (0.22%) |
130.64 |
128.95 - 132.23 |
0.5284 times |
Mon 20 October 2025 |
130.73 (3.34%) |
128.49 |
127.80 - 132.30 |
0.649 times |
Fri 17 October 2025 |
126.50 (0.36%) |
123.46 |
121.24 - 127.60 |
0.8631 times |
Thu 16 October 2025 |
126.05 (0.32%) |
128.65 |
123.35 - 130.04 |
1.2635 times |
Wed 15 October 2025 |
125.65 (2.77%) |
127.36 |
121.19 - 128.70 |
1.1961 times |
Tue 14 October 2025 |
122.26 (-3.79%) |
122.00 |
117.77 - 125.98 |
1.5361 times |
Mon 13 October 2025 |
127.08 (-1.5%) |
126.51 |
124.46 - 128.29 |
1.1821 times |
Tue 07 October 2025 |
129.01 (-2.01%) |
133.60 |
126.94 - 134.22 |
0.8946 times |
Mon 06 October 2025 |
131.65 (3%) |
130.00 |
129.87 - 134.11 |
0.7492 times |
Weekly price and charts TechnologyBull Strong weekly Stock price targets for TechnologyBull TECL are 126.87 and 137.08 | Weekly Target 1 | 118.47 | | Weekly Target 2 | 125.06 | | Weekly Target 3 | 128.68 | | Weekly Target 4 | 135.27 | | Weekly Target 5 | 138.89 |
Weekly price and volumes for Technology Bull
| Date |
Closing |
Open |
Range |
Volume |
Thu 23 October 2025 |
131.65 (4.07%) |
128.49 |
122.09 - 132.30 |
0.8464 times |
Fri 17 October 2025 |
126.50 (-1.95%) |
126.51 |
117.77 - 130.04 |
1.6684 times |
Tue 07 October 2025 |
129.01 (0.94%) |
130.00 |
126.94 - 134.22 |
0.454 times |
Fri 03 October 2025 |
127.81 (6.2%) |
122.35 |
121.39 - 132.10 |
0.8671 times |
Fri 26 September 2025 |
120.35 (0.11%) |
119.66 |
114.49 - 125.88 |
1.1633 times |
Fri 19 September 2025 |
120.22 (8.66%) |
111.18 |
107.74 - 120.65 |
1.2772 times |
Fri 12 September 2025 |
110.64 (9.11%) |
103.13 |
102.08 - 112.38 |
1.3048 times |
Fri 05 September 2025 |
101.40 (0.15%) |
95.30 |
94.05 - 104.15 |
1.1348 times |
Fri 29 August 2025 |
101.25 (0%) |
104.80 |
100.02 - 104.80 |
0.3151 times |
Fri 29 August 2025 |
101.25 (-0.29%) |
101.31 |
99.96 - 106.84 |
0.9688 times |
Fri 22 August 2025 |
101.54 (-4.03%) |
105.23 |
94.10 - 106.65 |
1.8286 times |

Monthly price and charts TechnologyBull Strong monthly Stock price targets for TechnologyBull TECL are 124.71 and 141.16 | Monthly Target 1 | 111.43 | | Monthly Target 2 | 121.54 | | Monthly Target 3 | 127.88 | | Monthly Target 4 | 137.99 | | Monthly Target 5 | 144.33 |
Monthly price and volumes Technology Bull
| Date |
Closing |
Open |
Range |
Volume |
Thu 23 October 2025 |
131.65 (5.85%) |
122.31 |
117.77 - 134.22 |
0.4914 times |
Tue 30 September 2025 |
124.37 (22.83%) |
95.30 |
94.05 - 125.88 |
0.7269 times |
Fri 29 August 2025 |
101.25 (-1.77%) |
100.00 |
94.10 - 111.12 |
0.9052 times |
Thu 31 July 2025 |
103.07 (10.14%) |
92.75 |
89.11 - 109.49 |
0.8475 times |
Mon 30 June 2025 |
93.58 (30.52%) |
71.02 |
70.80 - 94.27 |
0.8426 times |
Fri 30 May 2025 |
71.70 (29.94%) |
58.64 |
56.17 - 76.95 |
1.1582 times |
Wed 30 April 2025 |
55.18 (-5.77%) |
57.71 |
32.52 - 62.53 |
2.1069 times |
Mon 31 March 2025 |
58.56 (-25.24%) |
80.00 |
53.59 - 80.24 |
1.2392 times |
Fri 28 February 2025 |
78.33 (-8.93%) |
80.32 |
72.68 - 99.62 |
0.7165 times |
Fri 31 January 2025 |
86.01 (-5.01%) |
92.57 |
80.34 - 101.18 |
0.9657 times |
Tue 31 December 2024 |
90.55 (-4.67%) |
101.10 |
88.00 - 102.45 |
0.5747 times |

DMA SMA EMA moving averages of Technology Bull TECL
DMA (daily moving average) of Technology Bull TECL
| DMA period | DMA value | | 5 day DMA | 129.38 | | 12 day DMA | 128.03 | | 20 day DMA | 126.15 | | 35 day DMA | 118.93 | | 50 day DMA | 114.3 | | 100 day DMA | 102.95 | | 150 day DMA | 87.95 | | 200 day DMA | 87.3 | EMA (exponential moving average) of Technology Bull TECL
| EMA period | EMA current | EMA prev | EMA prev2 | | 5 day EMA | 129.34 | 128.19 | 128.79 | | 12 day EMA | 127.6 | 126.86 | 126.84 | | 20 day EMA | 125.17 | 124.49 | 124.23 | | 35 day EMA | 120.27 | 119.6 | 119.17 | | 50 day EMA | 114.92 | 114.24 | 113.72 |
SMA (simple moving average) of Technology Bull TECL
| SMA period | SMA current | SMA prev | SMA prev2 | | 5 day SMA | 129.38 | 128.26 | 127.99 | | 12 day SMA | 128.03 | 127.9 | 127.97 | | 20 day SMA | 126.15 | 125.85 | 125.51 | | 35 day SMA | 118.93 | 118.06 | 117.32 | | 50 day SMA | 114.3 | 113.75 | 113.34 | | 100 day SMA | 102.95 | 102.37 | 101.78 | | 150 day SMA | 87.95 | 87.51 | 87.07 | | 200 day SMA | 87.3 | 87.09 | 86.91 |
|
|
