IsharesU TECB full analysis,charts,indicators,moving averages,SMA,DMA,EMA,ADX,MACD,RSIIshares U TECB WideScreen charts, DMA,SMA,EMA technical analysis, forecast prediction, by indicators ADX,MACD,RSI,CCI AMEX stock exchange
Daily price and charts and targets IsharesU Strong Daily Stock price targets for IsharesU TECB are 61.93 and 62.53 | Daily Target 1 | 61.44 | | Daily Target 2 | 61.81 | | Daily Target 3 | 62.036666666667 | | Daily Target 4 | 62.41 | | Daily Target 5 | 62.64 |
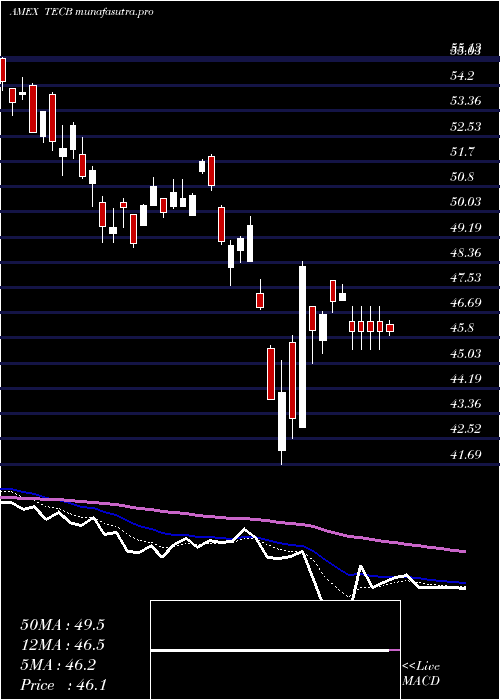
Daily price and volume Ishares U
| Date |
Closing |
Open |
Range |
Volume |
Thu 23 October 2025 |
62.19 (1.09%) |
61.66 |
61.66 - 62.26 |
1.1936 times |
Wed 22 October 2025 |
61.52 (-1.22%) |
62.05 |
61.19 - 62.05 |
0.5836 times |
Tue 21 October 2025 |
62.28 (0.52%) |
62.04 |
61.87 - 62.33 |
1.252 times |
Mon 20 October 2025 |
61.96 (1.51%) |
61.10 |
61.10 - 62.05 |
0.7834 times |
Fri 17 October 2025 |
61.04 (0.23%) |
60.57 |
60.57 - 61.05 |
0.4668 times |
Thu 16 October 2025 |
60.90 (-0.49%) |
61.44 |
60.69 - 61.78 |
1.0763 times |
Wed 15 October 2025 |
61.20 (0.69%) |
61.21 |
60.98 - 61.56 |
0.9631 times |
Tue 14 October 2025 |
60.78 (-0.7%) |
60.50 |
60.16 - 61.24 |
1.1022 times |
Mon 13 October 2025 |
61.21 (1.69%) |
60.77 |
60.77 - 61.29 |
1.2413 times |
Fri 10 October 2025 |
60.19 (-3.28%) |
62.31 |
60.17 - 62.50 |
1.3376 times |
Thu 09 October 2025 |
62.23 (0.14%) |
62.16 |
61.94 - 62.24 |
1.0273 times |
Weekly price and charts IsharesU Strong weekly Stock price targets for IsharesU TECB are 61.65 and 62.88 | Weekly Target 1 | 60.64 | | Weekly Target 2 | 61.42 | | Weekly Target 3 | 61.873333333333 | | Weekly Target 4 | 62.65 | | Weekly Target 5 | 63.1 |
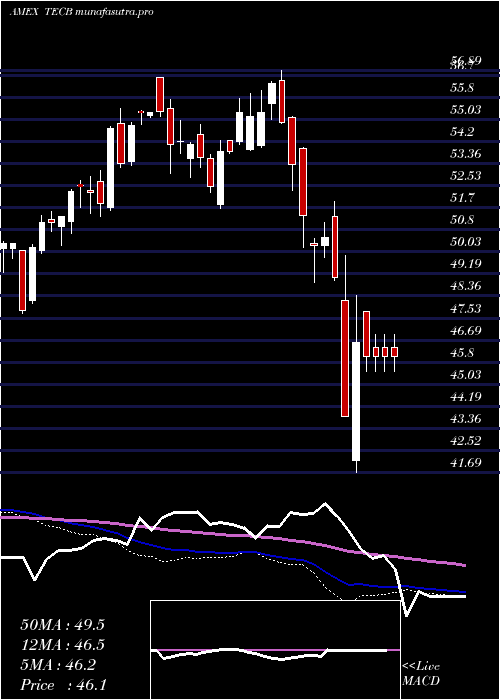
Weekly price and volumes for Ishares U
| Date |
Closing |
Open |
Range |
Volume |
Thu 23 October 2025 |
62.19 (1.88%) |
61.10 |
61.10 - 62.33 |
0.6145 times |
Fri 17 October 2025 |
61.04 (1.41%) |
60.77 |
60.16 - 61.78 |
0.7816 times |
Fri 10 October 2025 |
60.19 (-1.07%) |
61.92 |
60.17 - 62.50 |
1.0505 times |
Fri 03 October 2025 |
60.84 (1.08%) |
60.36 |
59.87 - 61.61 |
0.8188 times |
Fri 26 September 2025 |
60.19 (-1.65%) |
61.02 |
59.59 - 61.52 |
1.9747 times |
Fri 19 September 2025 |
61.20 (3.2%) |
59.54 |
59.53 - 61.23 |
1.9747 times |
Fri 12 September 2025 |
59.30 (1.87%) |
58.33 |
58.33 - 60.02 |
1.0779 times |
Fri 05 September 2025 |
58.21 (0.03%) |
57.24 |
57.17 - 58.43 |
0.6657 times |
Fri 29 August 2025 |
58.19 (0%) |
58.55 |
58.10 - 58.55 |
0.1845 times |
Fri 29 August 2025 |
58.19 (-0.15%) |
58.14 |
57.84 - 58.80 |
0.8571 times |
Fri 22 August 2025 |
58.28 (-0.53%) |
58.50 |
56.68 - 58.54 |
0.8985 times |
Monthly price and charts IsharesU Strong monthly Stock price targets for IsharesU TECB are 61.13 and 63.56 | Monthly Target 1 | 59.16 | | Monthly Target 2 | 60.67 | | Monthly Target 3 | 61.586666666667 | | Monthly Target 4 | 63.1 | | Monthly Target 5 | 64.02 |
Monthly price and volumes Ishares U
| Date |
Closing |
Open |
Range |
Volume |
Thu 23 October 2025 |
62.19 (3.03%) |
60.13 |
60.07 - 62.50 |
0.3355 times |
Tue 30 September 2025 |
60.36 (3.73%) |
57.24 |
57.17 - 61.52 |
0.6665 times |
Fri 29 August 2025 |
58.19 (0.67%) |
57.02 |
56.40 - 58.80 |
0.4663 times |
Thu 31 July 2025 |
57.80 (0.77%) |
57.09 |
56.62 - 58.87 |
0.6412 times |
Mon 30 June 2025 |
57.36 (7.03%) |
53.47 |
53.22 - 57.37 |
0.6512 times |
Fri 30 May 2025 |
53.59 (6.41%) |
51.03 |
50.43 - 54.36 |
0.8933 times |
Wed 30 April 2025 |
50.36 (2.99%) |
48.75 |
41.69 - 50.39 |
1.9244 times |
Mon 31 March 2025 |
48.90 (-8.32%) |
53.92 |
47.58 - 53.97 |
1.3428 times |
Fri 28 February 2025 |
53.34 (-3.25%) |
54.03 |
52.33 - 56.89 |
1.5542 times |
Fri 31 January 2025 |
55.13 (3.65%) |
53.64 |
51.65 - 56.00 |
1.5244 times |
Tue 31 December 2024 |
53.19 (-3.8%) |
56.59 |
52.98 - 56.59 |
0.7885 times |

DMA SMA EMA moving averages of Ishares U TECB
DMA (daily moving average) of Ishares U TECB
| DMA period | DMA value | | 5 day DMA | 61.8 | | 12 day DMA | 61.47 | | 20 day DMA | 61.23 | | 35 day DMA | 60.66 | | 50 day DMA | 59.88 | | 100 day DMA | 58.38 | | 150 day DMA | 55.55 | | 200 day DMA | 55.08 | EMA (exponential moving average) of Ishares U TECB
| EMA period | EMA current | EMA prev | EMA prev2 | | 5 day EMA | 61.8 | 61.61 | 61.66 | | 12 day EMA | 61.5 | 61.38 | 61.35 | | 20 day EMA | 61.19 | 61.09 | 61.04 | | 35 day EMA | 60.56 | 60.46 | 60.4 | | 50 day EMA | 59.89 | 59.8 | 59.73 |
SMA (simple moving average) of Ishares U TECB
| SMA period | SMA current | SMA prev | SMA prev2 | | 5 day SMA | 61.8 | 61.54 | 61.48 | | 12 day SMA | 61.47 | 61.4 | 61.42 | | 20 day SMA | 61.23 | 61.12 | 61.07 | | 35 day SMA | 60.66 | 60.54 | 60.44 | | 50 day SMA | 59.88 | 59.8 | 59.74 | | 100 day SMA | 58.38 | 58.3 | 58.22 | | 150 day SMA | 55.55 | 55.48 | 55.4 | | 200 day SMA | 55.08 | 55.04 | 55.01 |
|
|
