SolarEtf TAN full analysis,charts,indicators,moving averages,SMA,DMA,EMA,ADX,MACD,RSISolar Etf TAN WideScreen charts, DMA,SMA,EMA technical analysis, forecast prediction, by indicators ADX,MACD,RSI,CCI AMEX stock exchange
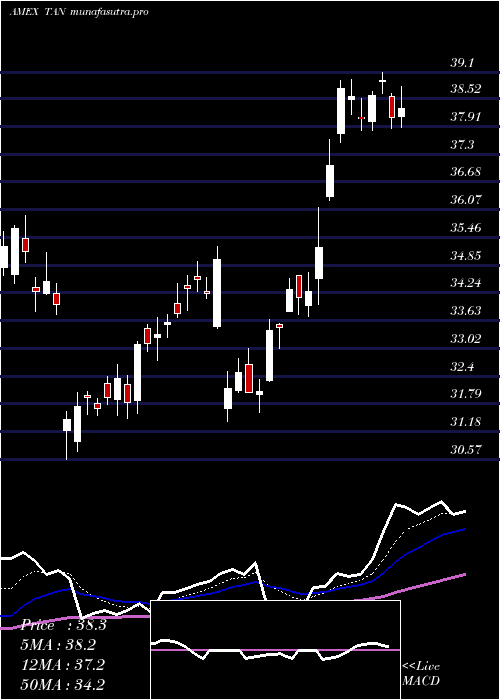
Daily price and charts and targets SolarEtf Strong Daily Stock price targets for SolarEtf TAN are 47.53 and 48.34 | Daily Target 1 | 47.35 | | Daily Target 2 | 47.71 | | Daily Target 3 | 48.163333333333 | | Daily Target 4 | 48.52 | | Daily Target 5 | 48.97 |
Daily price and volume Solar Etf
| Date |
Closing |
Open |
Range |
Volume |
Fri 24 October 2025 |
48.06 (3.33%) |
48.16 |
47.81 - 48.62 |
0.5403 times |
Thu 23 October 2025 |
46.51 (1.24%) |
46.01 |
45.67 - 46.76 |
0.238 times |
Wed 22 October 2025 |
45.94 (-1.86%) |
46.41 |
45.03 - 46.66 |
0.6439 times |
Tue 21 October 2025 |
46.81 (-0.78%) |
47.70 |
46.48 - 47.70 |
0.443 times |
Mon 20 October 2025 |
47.18 (1.33%) |
46.99 |
46.92 - 47.53 |
0.5637 times |
Fri 17 October 2025 |
46.56 (-3.06%) |
46.96 |
46.28 - 47.31 |
1.4672 times |
Thu 16 October 2025 |
48.03 (-1.84%) |
49.50 |
47.80 - 49.60 |
1.5648 times |
Wed 15 October 2025 |
48.93 (4.35%) |
48.26 |
47.51 - 49.32 |
2.4863 times |
Tue 14 October 2025 |
46.89 (1.23%) |
45.81 |
45.37 - 47.61 |
1.04 times |
Mon 13 October 2025 |
46.32 (1.4%) |
45.95 |
45.88 - 47.00 |
1.0128 times |
Tue 07 October 2025 |
45.68 (-1.21%) |
46.30 |
45.36 - 46.52 |
0.995 times |
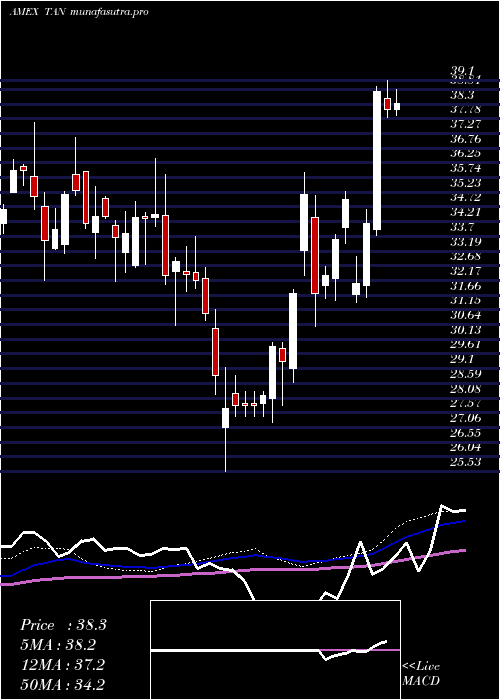
Weekly price and charts SolarEtf Strong weekly Stock price targets for SolarEtf TAN are 46.55 and 50.14 | Weekly Target 1 | 43.65 | | Weekly Target 2 | 45.85 | | Weekly Target 3 | 47.236666666667 | | Weekly Target 4 | 49.44 | | Weekly Target 5 | 50.83 |
Weekly price and volumes for Solar Etf
| Date |
Closing |
Open |
Range |
Volume |
Fri 24 October 2025 |
48.06 (3.22%) |
46.99 |
45.03 - 48.62 |
0.6346 times |
Fri 17 October 2025 |
46.56 (1.93%) |
45.95 |
45.37 - 49.60 |
1.978 times |
Tue 07 October 2025 |
45.68 (-0.65%) |
46.22 |
45.36 - 46.80 |
0.3799 times |
Fri 03 October 2025 |
45.98 (5.9%) |
43.90 |
43.18 - 46.96 |
1.0476 times |
Fri 26 September 2025 |
43.42 (0.58%) |
42.61 |
42.22 - 44.08 |
0.9188 times |
Fri 19 September 2025 |
43.17 (3.33%) |
41.77 |
41.33 - 43.78 |
1.2565 times |
Fri 12 September 2025 |
41.78 (-5.13%) |
44.12 |
41.40 - 44.13 |
1.1161 times |
Fri 05 September 2025 |
44.04 (5.99%) |
40.16 |
39.75 - 44.49 |
1.2098 times |
Fri 29 August 2025 |
41.55 (0%) |
41.61 |
41.44 - 42.04 |
0.1172 times |
Fri 29 August 2025 |
41.55 (-0.81%) |
41.52 |
40.85 - 42.63 |
1.3414 times |
Fri 22 August 2025 |
41.89 (5.15%) |
40.92 |
39.36 - 42.04 |
1.9139 times |
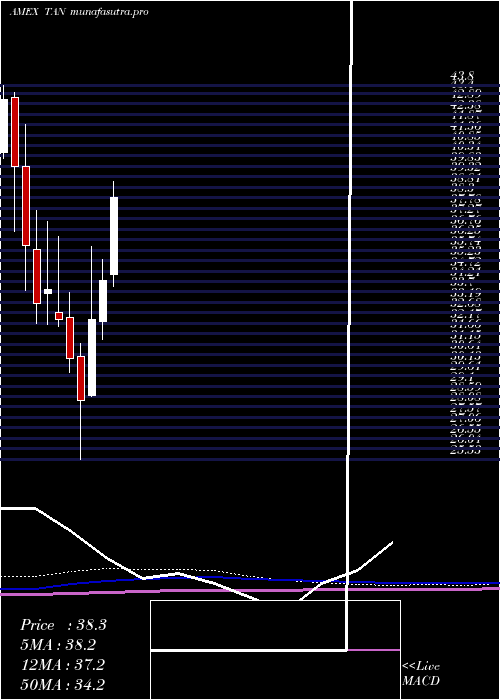
Monthly price and charts SolarEtf Strong monthly Stock price targets for SolarEtf TAN are 46.06 and 51.6 | Monthly Target 1 | 41.7 | | Monthly Target 2 | 44.88 | | Monthly Target 3 | 47.24 | | Monthly Target 4 | 50.42 | | Monthly Target 5 | 52.78 |
Monthly price and volumes Solar Etf
| Date |
Closing |
Open |
Range |
Volume |
Fri 24 October 2025 |
48.06 (10.15%) |
44.06 |
44.06 - 49.60 |
0.7207 times |
Tue 30 September 2025 |
43.63 (5.01%) |
40.16 |
39.75 - 44.49 |
0.947 times |
Fri 29 August 2025 |
41.55 (12.91%) |
37.14 |
35.98 - 42.63 |
1.0355 times |
Thu 31 July 2025 |
36.80 (7.41%) |
34.56 |
33.97 - 40.35 |
0.9581 times |
Mon 30 June 2025 |
34.26 (5.9%) |
32.23 |
31.40 - 35.26 |
0.8982 times |
Fri 30 May 2025 |
32.35 (13.99%) |
28.65 |
28.57 - 35.93 |
1.8283 times |
Wed 30 April 2025 |
28.38 (-6.83%) |
30.57 |
25.53 - 31.17 |
0.892 times |
Mon 31 March 2025 |
30.46 (-5.84%) |
32.47 |
29.76 - 33.69 |
0.6992 times |
Fri 28 February 2025 |
32.35 (-4.29%) |
32.69 |
32.03 - 36.40 |
0.7384 times |
Fri 31 January 2025 |
33.80 (2.05%) |
33.60 |
32.12 - 37.12 |
1.2826 times |
Tue 31 December 2024 |
33.12 (-7.92%) |
35.79 |
32.15 - 37.66 |
0.8244 times |
DMA SMA EMA moving averages of Solar Etf TAN
DMA (daily moving average) of Solar Etf TAN
| DMA period | DMA value | | 5 day DMA | 46.9 | | 12 day DMA | 46.93 | | 20 day DMA | 45.92 | | 35 day DMA | 44.48 | | 50 day DMA | 43.32 | | 100 day DMA | 39.62 | | 150 day DMA | 36.57 | | 200 day DMA | 35.87 | EMA (exponential moving average) of Solar Etf TAN
| EMA period | EMA current | EMA prev | EMA prev2 | | 5 day EMA | 47.1 | 46.62 | 46.67 | | 12 day EMA | 46.63 | 46.37 | 46.35 | | 20 day EMA | 45.92 | 45.7 | 45.61 | | 35 day EMA | 44.59 | 44.39 | 44.26 | | 50 day EMA | 43.12 | 42.92 | 42.77 |
SMA (simple moving average) of Solar Etf TAN
| SMA period | SMA current | SMA prev | SMA prev2 | | 5 day SMA | 46.9 | 46.6 | 46.9 | | 12 day SMA | 46.93 | 46.76 | 46.73 | | 20 day SMA | 45.92 | 45.63 | 45.5 | | 35 day SMA | 44.48 | 44.28 | 44.14 | | 50 day SMA | 43.32 | 43.09 | 42.9 | | 100 day SMA | 39.62 | 39.46 | 39.31 | | 150 day SMA | 36.57 | 36.48 | 36.38 | | 200 day SMA | 35.87 | 35.8 | 35.74 |
|
|
