UsaEsg SUSA full analysis,charts,indicators,moving averages,SMA,DMA,EMA,ADX,MACD,RSIUsa Esg SUSA WideScreen charts, DMA,SMA,EMA technical analysis, forecast prediction, by indicators ADX,MACD,RSI,CCI AMEX stock exchange
Daily price and charts and targets UsaEsg Strong Daily Stock price targets for UsaEsg SUSA are 136.58 and 137.72 | Daily Target 1 | 135.66 | | Daily Target 2 | 136.35 | | Daily Target 3 | 136.8 | | Daily Target 4 | 137.49 | | Daily Target 5 | 137.94 |
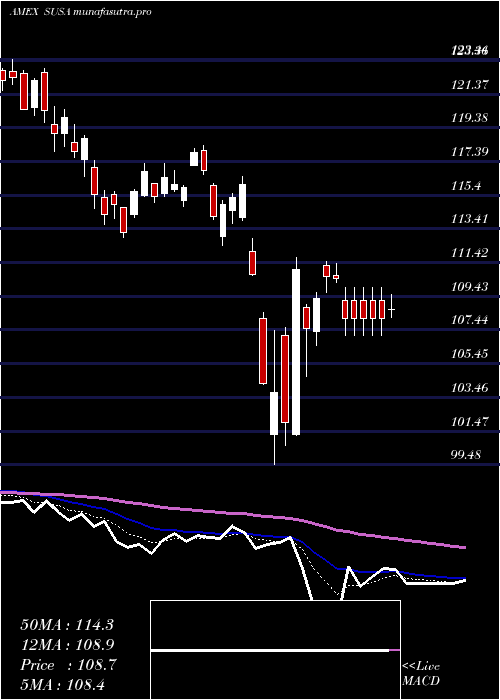
Daily price and volume Usa Esg
| Date |
Closing |
Open |
Range |
Volume |
Thu 23 October 2025 |
137.04 (0.62%) |
136.11 |
136.11 - 137.25 |
0.6836 times |
Wed 22 October 2025 |
136.19 (-0.69%) |
137.10 |
135.47 - 137.10 |
0.8156 times |
Tue 21 October 2025 |
137.13 (0.22%) |
136.77 |
136.62 - 137.36 |
0.4581 times |
Mon 20 October 2025 |
136.83 (1.09%) |
136.02 |
135.89 - 136.99 |
0.3395 times |
Fri 17 October 2025 |
135.36 (0.71%) |
134.17 |
134.14 - 135.66 |
3.1156 times |
Thu 16 October 2025 |
134.41 (-0.67%) |
135.68 |
133.86 - 135.94 |
2.1682 times |
Wed 15 October 2025 |
135.32 (0.4%) |
135.78 |
134.52 - 136.31 |
0.5547 times |
Tue 14 October 2025 |
134.78 (-0.03%) |
133.59 |
133.21 - 135.34 |
0.7431 times |
Mon 13 October 2025 |
134.82 (1.41%) |
134.61 |
134.31 - 135.14 |
0.5363 times |
Fri 10 October 2025 |
132.94 (-2.54%) |
136.76 |
132.87 - 136.96 |
0.5853 times |
Thu 09 October 2025 |
136.41 (-0.47%) |
137.13 |
136.14 - 137.34 |
0.7431 times |
Weekly price and charts UsaEsg Strong weekly Stock price targets for UsaEsg SUSA are 136.26 and 138.15 | Weekly Target 1 | 134.73 | | Weekly Target 2 | 135.89 | | Weekly Target 3 | 136.62333333333 | | Weekly Target 4 | 137.78 | | Weekly Target 5 | 138.51 |
Weekly price and volumes for Usa Esg
| Date |
Closing |
Open |
Range |
Volume |
Thu 23 October 2025 |
137.04 (1.24%) |
136.02 |
135.47 - 137.36 |
0.5066 times |
Fri 17 October 2025 |
135.36 (1.82%) |
134.61 |
133.21 - 136.31 |
1.57 times |
Fri 10 October 2025 |
132.94 (-2.66%) |
137.18 |
132.87 - 137.47 |
0.8301 times |
Fri 03 October 2025 |
136.57 (1.31%) |
135.45 |
134.81 - 137.17 |
1.1205 times |
Fri 26 September 2025 |
134.81 (0.02%) |
134.61 |
133.07 - 135.79 |
1.1639 times |
Fri 19 September 2025 |
134.78 (0.85%) |
133.91 |
133.05 - 134.98 |
1.5053 times |
Fri 12 September 2025 |
133.64 (1.17%) |
132.26 |
131.84 - 134.11 |
1.4238 times |
Fri 05 September 2025 |
132.10 (0.33%) |
130.01 |
129.55 - 132.94 |
0.952 times |
Fri 29 August 2025 |
131.67 (0%) |
132.25 |
131.49 - 132.25 |
0.1051 times |
Fri 29 August 2025 |
131.67 (0%) |
131.39 |
130.97 - 132.55 |
0.8226 times |
Fri 22 August 2025 |
131.67 (0.77%) |
130.53 |
129.17 - 131.99 |
1.6523 times |

Monthly price and charts UsaEsg Strong monthly Stock price targets for UsaEsg SUSA are 134.96 and 139.56 | Monthly Target 1 | 131.19 | | Monthly Target 2 | 134.12 | | Monthly Target 3 | 135.79333333333 | | Monthly Target 4 | 138.72 | | Monthly Target 5 | 140.39 |
Monthly price and volumes Usa Esg
| Date |
Closing |
Open |
Range |
Volume |
Thu 23 October 2025 |
137.04 (1.02%) |
135.09 |
132.87 - 137.47 |
0.5816 times |
Tue 30 September 2025 |
135.65 (3.02%) |
130.01 |
129.55 - 135.79 |
0.9238 times |
Fri 29 August 2025 |
131.67 (2.39%) |
127.54 |
126.12 - 132.55 |
0.6851 times |
Thu 31 July 2025 |
128.60 (1.46%) |
126.29 |
125.60 - 130.21 |
0.7114 times |
Mon 30 June 2025 |
126.75 (3.9%) |
121.67 |
120.86 - 127.00 |
0.5429 times |
Fri 30 May 2025 |
121.99 (6.24%) |
115.75 |
115.00 - 123.65 |
0.8942 times |
Wed 30 April 2025 |
114.83 (-0.03%) |
114.47 |
99.48 - 116.49 |
1.8037 times |
Mon 31 March 2025 |
114.87 (-5.99%) |
122.62 |
112.45 - 122.90 |
1.1138 times |
Fri 28 February 2025 |
122.19 (-1.86%) |
122.68 |
120.09 - 125.72 |
1.4609 times |
Fri 31 January 2025 |
124.51 (2.4%) |
122.23 |
119.32 - 126.59 |
1.2825 times |
Tue 31 December 2024 |
121.59 (-3.18%) |
126.73 |
120.68 - 126.78 |
0.7395 times |

DMA SMA EMA moving averages of Usa Esg SUSA
DMA (daily moving average) of Usa Esg SUSA
| DMA period | DMA value | | 5 day DMA | 136.51 | | 12 day DMA | 135.69 | | 20 day DMA | 135.82 | | 35 day DMA | 134.92 | | 50 day DMA | 133.79 | | 100 day DMA | 130.25 | | 150 day DMA | 125.07 | | 200 day DMA | 124.28 | EMA (exponential moving average) of Usa Esg SUSA
| EMA period | EMA current | EMA prev | EMA prev2 | | 5 day EMA | 136.45 | 136.16 | 136.14 | | 12 day EMA | 135.97 | 135.77 | 135.69 | | 20 day EMA | 135.57 | 135.42 | 135.34 | | 35 day EMA | 134.69 | 134.55 | 134.45 | | 50 day EMA | 133.8 | 133.67 | 133.57 |
SMA (simple moving average) of Usa Esg SUSA
| SMA period | SMA current | SMA prev | SMA prev2 | | 5 day SMA | 136.51 | 135.98 | 135.81 | | 12 day SMA | 135.69 | 135.62 | 135.69 | | 20 day SMA | 135.82 | 135.65 | 135.56 | | 35 day SMA | 134.92 | 134.77 | 134.63 | | 50 day SMA | 133.79 | 133.67 | 133.58 | | 100 day SMA | 130.25 | 130.1 | 129.96 | | 150 day SMA | 125.07 | 124.93 | 124.8 | | 200 day SMA | 124.28 | 124.21 | 124.14 |
|
|
