SP SUB full analysis,charts,indicators,moving averages,SMA,DMA,EMA,ADX,MACD,RSIS P SUB WideScreen charts, DMA,SMA,EMA technical analysis, forecast prediction, by indicators ADX,MACD,RSI,CCI AMEX stock exchange
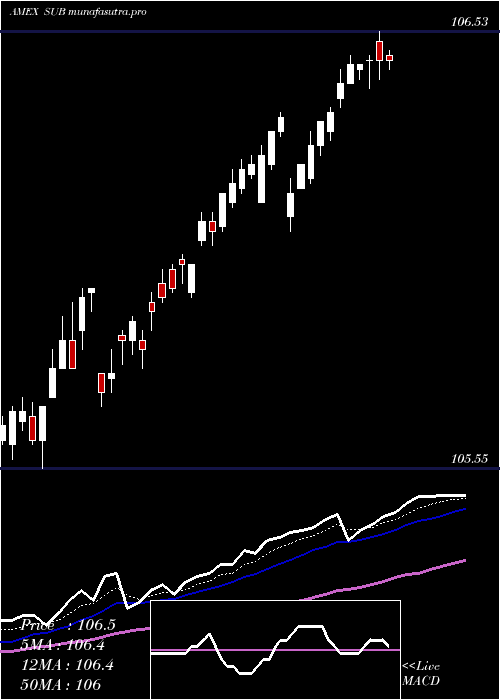
Daily price and charts and targets SP Strong Daily Stock price targets for SP SUB are 106.39 and 106.48 | Daily Target 1 | 106.37 | | Daily Target 2 | 106.41 | | Daily Target 3 | 106.46333333333 | | Daily Target 4 | 106.5 | | Daily Target 5 | 106.55 |
Daily price and volume S P
| Date |
Closing |
Open |
Range |
Volume |
Fri 24 October 2025 |
106.44 (-0.02%) |
106.48 |
106.43 - 106.52 |
0.518 times |
Thu 23 October 2025 |
106.46 (-0.07%) |
106.52 |
106.45 - 106.52 |
0.4899 times |
Wed 22 October 2025 |
106.53 (0%) |
106.50 |
106.48 - 106.63 |
0.5704 times |
Tue 21 October 2025 |
106.53 (-0.01%) |
106.55 |
106.53 - 106.62 |
0.9555 times |
Mon 20 October 2025 |
106.54 (-0.2%) |
106.57 |
106.52 - 106.63 |
0.5056 times |
Fri 17 October 2025 |
106.75 (-0.06%) |
106.77 |
106.66 - 106.79 |
4.1101 times |
Thu 16 October 2025 |
106.81 (0.12%) |
106.72 |
106.69 - 106.81 |
0.8713 times |
Wed 15 October 2025 |
106.68 (-0.07%) |
106.64 |
106.62 - 106.84 |
0.8203 times |
Tue 14 October 2025 |
106.75 (-0.02%) |
106.62 |
106.62 - 106.75 |
0.5894 times |
Mon 13 October 2025 |
106.77 (0.1%) |
106.70 |
106.68 - 106.78 |
0.5695 times |
Fri 10 October 2025 |
106.66 (0.05%) |
106.65 |
106.60 - 106.70 |
0.7002 times |
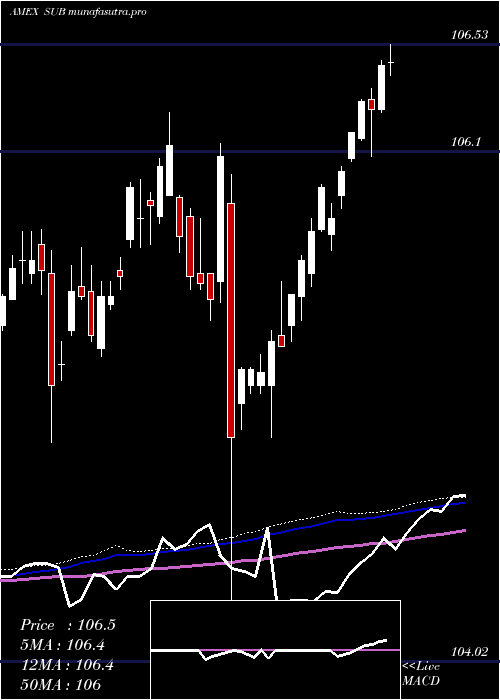
Weekly price and charts SP Strong weekly Stock price targets for SP SUB are 106.34 and 106.54 | Weekly Target 1 | 106.3 | | Weekly Target 2 | 106.37 | | Weekly Target 3 | 106.5 | | Weekly Target 4 | 106.57 | | Weekly Target 5 | 106.7 |
Weekly price and volumes for S P
| Date |
Closing |
Open |
Range |
Volume |
Fri 24 October 2025 |
106.44 (-0.29%) |
106.57 |
106.43 - 106.63 |
0.6378 times |
Fri 17 October 2025 |
106.75 (0.08%) |
106.70 |
106.62 - 106.84 |
1.4606 times |
Fri 10 October 2025 |
106.66 (-0.02%) |
106.60 |
106.45 - 106.74 |
0.8165 times |
Fri 03 October 2025 |
106.68 (-0.07%) |
106.75 |
106.59 - 106.82 |
1.0897 times |
Fri 26 September 2025 |
106.76 (-0.31%) |
107.09 |
106.73 - 107.12 |
1.0877 times |
Fri 19 September 2025 |
107.09 (-0.11%) |
107.29 |
107.06 - 107.32 |
1.9067 times |
Fri 12 September 2025 |
107.21 (0.15%) |
107.05 |
107.03 - 107.31 |
1.3669 times |
Fri 05 September 2025 |
107.05 (0.05%) |
106.87 |
106.75 - 107.06 |
0.7592 times |
Fri 29 August 2025 |
107.00 (0%) |
106.98 |
106.97 - 107.03 |
0.116 times |
Fri 29 August 2025 |
107.00 (0.03%) |
106.97 |
106.91 - 107.03 |
0.7589 times |
Fri 22 August 2025 |
106.97 (0.08%) |
106.85 |
106.85 - 107.01 |
0.9991 times |
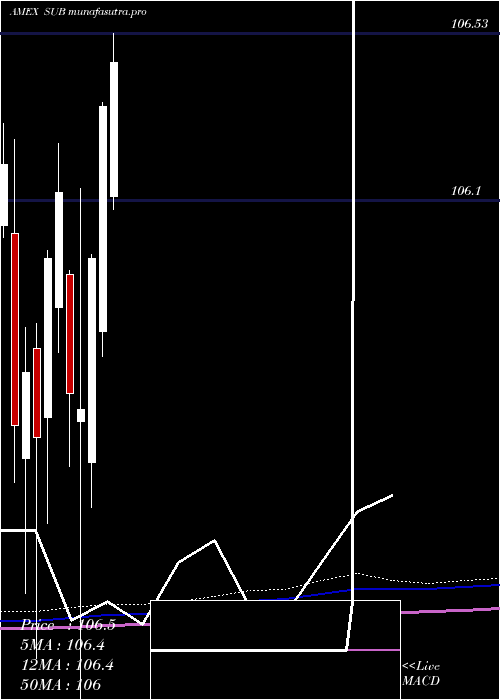
Monthly price and charts SP Strong monthly Stock price targets for SP SUB are 106.23 and 106.64 | Monthly Target 1 | 106.16 | | Monthly Target 2 | 106.3 | | Monthly Target 3 | 106.57 | | Monthly Target 4 | 106.71 | | Monthly Target 5 | 106.98 |
Monthly price and volumes S P
| Date |
Closing |
Open |
Range |
Volume |
Fri 24 October 2025 |
106.44 (-0.32%) |
106.61 |
106.43 - 106.84 |
0.8172 times |
Tue 30 September 2025 |
106.78 (-0.21%) |
106.87 |
106.73 - 107.32 |
1.3148 times |
Fri 29 August 2025 |
107.00 (0.25%) |
106.66 |
106.61 - 107.03 |
0.8557 times |
Thu 31 July 2025 |
106.73 (0.37%) |
106.11 |
106.08 - 106.85 |
0.9368 times |
Mon 30 June 2025 |
106.34 (0.37%) |
105.76 |
105.69 - 106.35 |
0.8558 times |
Fri 30 May 2025 |
105.95 (0.37%) |
105.42 |
105.30 - 105.96 |
0.8653 times |
Wed 30 April 2025 |
105.56 (-0.04%) |
105.52 |
104.02 - 106.13 |
1.6012 times |
Mon 31 March 2025 |
105.60 (-0.49%) |
105.91 |
105.41 - 105.92 |
1.0361 times |
Fri 28 February 2025 |
106.12 (0.16%) |
105.82 |
105.71 - 106.25 |
0.718 times |
Fri 31 January 2025 |
105.95 (0.45%) |
105.54 |
105.26 - 105.97 |
0.9991 times |
Tue 31 December 2024 |
105.48 (-0.16%) |
105.72 |
104.91 - 105.78 |
0.7291 times |
DMA SMA EMA moving averages of S P SUB
DMA (daily moving average) of S P SUB
| DMA period | DMA value | | 5 day DMA | 106.5 | | 12 day DMA | 106.63 | | 20 day DMA | 106.64 | | 35 day DMA | 106.83 | | 50 day DMA | 106.86 | | 100 day DMA | 106.63 | | 150 day DMA | 106.24 | | 200 day DMA | 106.11 | EMA (exponential moving average) of S P SUB
| EMA period | EMA current | EMA prev | EMA prev2 | | 5 day EMA | 106.51 | 106.55 | 106.59 | | 12 day EMA | 106.59 | 106.62 | 106.65 | | 20 day EMA | 106.67 | 106.69 | 106.71 | | 35 day EMA | 106.74 | 106.76 | 106.78 | | 50 day EMA | 106.83 | 106.85 | 106.87 |
SMA (simple moving average) of S P SUB
| SMA period | SMA current | SMA prev | SMA prev2 | | 5 day SMA | 106.5 | 106.56 | 106.63 | | 12 day SMA | 106.63 | 106.64 | 106.66 | | 20 day SMA | 106.64 | 106.66 | 106.68 | | 35 day SMA | 106.83 | 106.85 | 106.86 | | 50 day SMA | 106.86 | 106.87 | 106.88 | | 100 day SMA | 106.63 | 106.62 | 106.61 | | 150 day SMA | 106.24 | 106.23 | 106.22 | | 200 day SMA | 106.11 | 106.11 | 106.1 |
|
|
