ProsharesS SPXT full analysis,charts,indicators,moving averages,SMA,DMA,EMA,ADX,MACD,RSIProshares S SPXT WideScreen charts, DMA,SMA,EMA technical analysis, forecast prediction, by indicators ADX,MACD,RSI,CCI AMEX stock exchange
Daily price and charts and targets ProsharesS Strong Daily Stock price targets for ProsharesS SPXT are 100.93 and 101.57 | Daily Target 1 | 100.43 | | Daily Target 2 | 100.79 | | Daily Target 3 | 101.06666666667 | | Daily Target 4 | 101.43 | | Daily Target 5 | 101.71 |
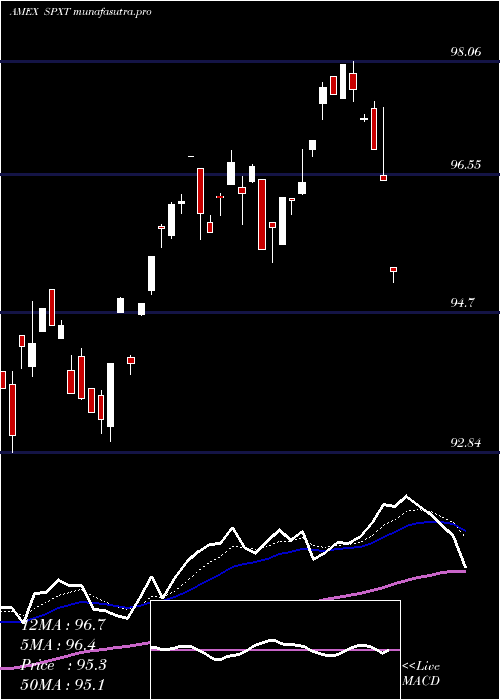
Daily price and volume Proshares S
| Date |
Closing |
Open |
Range |
Volume |
Thu 23 October 2025 |
101.16 (0.31%) |
100.93 |
100.70 - 101.34 |
4.1082 times |
Wed 22 October 2025 |
100.85 (-0.4%) |
101.31 |
100.54 - 101.31 |
0.6714 times |
Tue 21 October 2025 |
101.25 (0.05%) |
101.24 |
101.16 - 101.47 |
0.7295 times |
Mon 20 October 2025 |
101.20 (1.13%) |
100.64 |
100.64 - 101.20 |
0.2019 times |
Fri 17 October 2025 |
100.07 (0.65%) |
99.39 |
99.39 - 100.23 |
0.5391 times |
Thu 16 October 2025 |
99.42 (-0.99%) |
100.78 |
99.17 - 100.78 |
0.8321 times |
Wed 15 October 2025 |
100.41 (0.21%) |
100.74 |
99.90 - 100.83 |
0.6833 times |
Tue 14 October 2025 |
100.20 (0.58%) |
99.08 |
99.08 - 100.33 |
0.3694 times |
Mon 13 October 2025 |
99.62 (1.04%) |
99.51 |
99.46 - 99.78 |
1.4312 times |
Fri 10 October 2025 |
98.59 (-2.01%) |
100.71 |
98.59 - 100.79 |
0.434 times |
Thu 09 October 2025 |
100.61 (-0.28%) |
100.94 |
100.41 - 100.94 |
0.6002 times |
Weekly price and charts ProsharesS Strong weekly Stock price targets for ProsharesS SPXT are 100.85 and 101.78 | Weekly Target 1 | 100.13 | | Weekly Target 2 | 100.64 | | Weekly Target 3 | 101.05666666667 | | Weekly Target 4 | 101.57 | | Weekly Target 5 | 101.99 |
Weekly price and volumes for Proshares S
| Date |
Closing |
Open |
Range |
Volume |
Thu 23 October 2025 |
101.16 (1.09%) |
100.64 |
100.54 - 101.47 |
1.9475 times |
Fri 17 October 2025 |
100.07 (1.5%) |
99.51 |
99.08 - 100.83 |
1.3147 times |
Fri 10 October 2025 |
98.59 (-2.33%) |
101.29 |
98.59 - 101.29 |
1.111 times |
Fri 03 October 2025 |
100.94 (0.52%) |
100.89 |
100.22 - 101.35 |
0.9476 times |
Fri 26 September 2025 |
100.42 (-1.03%) |
101.35 |
99.62 - 101.53 |
0.5668 times |
Fri 19 September 2025 |
101.47 (0.81%) |
101.23 |
100.85 - 101.72 |
0.7683 times |
Fri 12 September 2025 |
100.65 (0.93%) |
99.72 |
99.39 - 100.96 |
0.6896 times |
Fri 05 September 2025 |
99.72 (0.7%) |
98.49 |
98.23 - 100.39 |
0.4314 times |
Fri 29 August 2025 |
99.03 (0%) |
99.31 |
99.03 - 99.62 |
0.5636 times |
Fri 29 August 2025 |
99.03 (-0.32%) |
99.06 |
98.74 - 99.62 |
1.6595 times |
Fri 22 August 2025 |
99.35 (1.22%) |
98.19 |
97.83 - 99.52 |
0.6707 times |

Monthly price and charts ProsharesS Strong monthly Stock price targets for ProsharesS SPXT are 99.88 and 102.76 | Monthly Target 1 | 97.53 | | Monthly Target 2 | 99.34 | | Monthly Target 3 | 100.40666666667 | | Monthly Target 4 | 102.22 | | Monthly Target 5 | 103.29 |
Monthly price and volumes Proshares S
| Date |
Closing |
Open |
Range |
Volume |
Thu 23 October 2025 |
101.16 (0.39%) |
100.48 |
98.59 - 101.47 |
1.0027 times |
Tue 30 September 2025 |
100.77 (1.76%) |
98.49 |
98.23 - 101.72 |
0.6365 times |
Fri 29 August 2025 |
99.03 (2.65%) |
95.30 |
95.10 - 99.62 |
0.7467 times |
Thu 31 July 2025 |
96.47 (0.67%) |
95.73 |
95.38 - 98.06 |
0.6011 times |
Mon 30 June 2025 |
95.83 (2.56%) |
92.93 |
92.84 - 95.87 |
0.385 times |
Fri 30 May 2025 |
93.44 (4.25%) |
89.40 |
89.40 - 94.13 |
0.9836 times |
Wed 30 April 2025 |
89.63 (-1.6%) |
90.87 |
79.66 - 91.90 |
1.3071 times |
Mon 31 March 2025 |
91.09 (-4.46%) |
95.90 |
88.87 - 95.90 |
1.3597 times |
Fri 28 February 2025 |
95.34 (-1.37%) |
95.23 |
94.00 - 97.03 |
1.2863 times |
Fri 31 January 2025 |
96.66 (5.57%) |
92.00 |
90.70 - 97.62 |
1.6913 times |
Tue 31 December 2024 |
91.56 (-3.98%) |
95.67 |
91.25 - 95.67 |
1.1968 times |

DMA SMA EMA moving averages of Proshares S SPXT
DMA (daily moving average) of Proshares S SPXT
| DMA period | DMA value | | 5 day DMA | 100.91 | | 12 day DMA | 100.36 | | 20 day DMA | 100.53 | | 35 day DMA | 100.57 | | 50 day DMA | 100.05 | | 100 day DMA | 97.89 | | 150 day DMA | 95.08 | | 200 day DMA | 94.87 | EMA (exponential moving average) of Proshares S SPXT
| EMA period | EMA current | EMA prev | EMA prev2 | | 5 day EMA | 100.87 | 100.72 | 100.66 | | 12 day EMA | 100.61 | 100.51 | 100.45 | | 20 day EMA | 100.5 | 100.43 | 100.39 | | 35 day EMA | 100.19 | 100.13 | 100.09 | | 50 day EMA | 99.92 | 99.87 | 99.83 |
SMA (simple moving average) of Proshares S SPXT
| SMA period | SMA current | SMA prev | SMA prev2 | | 5 day SMA | 100.91 | 100.56 | 100.47 | | 12 day SMA | 100.36 | 100.34 | 100.37 | | 20 day SMA | 100.53 | 100.46 | 100.44 | | 35 day SMA | 100.57 | 100.54 | 100.49 | | 50 day SMA | 100.05 | 99.99 | 99.94 | | 100 day SMA | 97.89 | 97.81 | 97.73 | | 150 day SMA | 95.08 | 95.01 | 94.95 | | 200 day SMA | 94.87 | 94.82 | 94.78 |
|
|
