TeucriumSoybean SOYB full analysis,charts,indicators,moving averages,SMA,DMA,EMA,ADX,MACD,RSITeucrium Soybean SOYB WideScreen charts, DMA,SMA,EMA technical analysis, forecast prediction, by indicators ADX,MACD,RSI,CCI AMEX stock exchange
Daily price and charts and targets TeucriumSoybean Strong Daily Stock price targets for TeucriumSoybean SOYB are 22.18 and 22.35 | Daily Target 1 | 22.04 | | Daily Target 2 | 22.15 | | Daily Target 3 | 22.213333333333 | | Daily Target 4 | 22.32 | | Daily Target 5 | 22.38 |
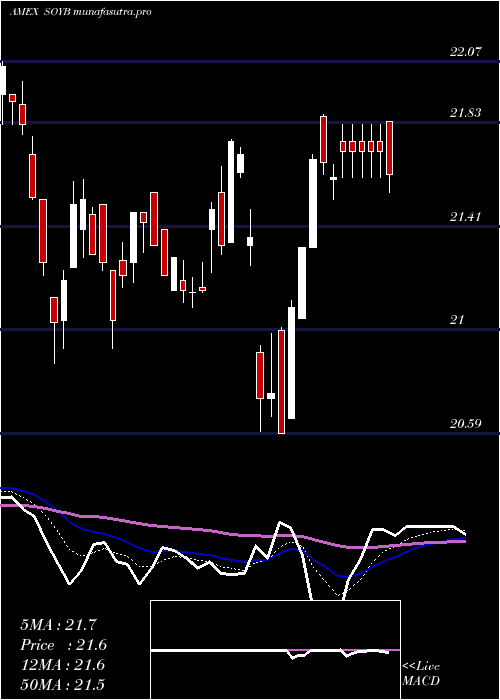
Daily price and volume Teucrium Soybean
| Date |
Closing |
Open |
Range |
Volume |
Thu 23 October 2025 |
22.25 (1.14%) |
22.15 |
22.11 - 22.28 |
1.057 times |
Wed 22 October 2025 |
22.00 (-0.09%) |
22.15 |
21.96 - 22.29 |
1.3473 times |
Tue 21 October 2025 |
22.02 (-0.18%) |
22.10 |
21.96 - 22.10 |
1.1183 times |
Mon 20 October 2025 |
22.06 (1.1%) |
22.05 |
21.94 - 22.10 |
0.968 times |
Fri 17 October 2025 |
21.82 (0.79%) |
21.75 |
21.75 - 21.85 |
0.5292 times |
Thu 16 October 2025 |
21.65 (0.28%) |
21.70 |
21.46 - 21.84 |
1.0755 times |
Wed 15 October 2025 |
21.59 (0.14%) |
21.59 |
21.53 - 21.67 |
1.5233 times |
Tue 14 October 2025 |
21.56 (-0.09%) |
21.56 |
21.47 - 21.60 |
1.0569 times |
Mon 13 October 2025 |
21.58 (0.09%) |
21.64 |
21.55 - 21.70 |
0.3406 times |
Fri 10 October 2025 |
21.56 (-1.28%) |
21.69 |
21.45 - 21.72 |
0.9838 times |
Thu 09 October 2025 |
21.84 (-0.36%) |
21.86 |
21.81 - 21.94 |
0.6695 times |
Weekly price and charts TeucriumSoybean Strong weekly Stock price targets for TeucriumSoybean SOYB are 22.1 and 22.45 | Weekly Target 1 | 21.81 | | Weekly Target 2 | 22.03 | | Weekly Target 3 | 22.16 | | Weekly Target 4 | 22.38 | | Weekly Target 5 | 22.51 |
Weekly price and volumes for Teucrium Soybean
| Date |
Closing |
Open |
Range |
Volume |
Thu 23 October 2025 |
22.25 (1.97%) |
22.05 |
21.94 - 22.29 |
1.1031 times |
Fri 17 October 2025 |
21.82 (1.21%) |
21.64 |
21.46 - 21.85 |
1.1117 times |
Fri 10 October 2025 |
21.56 (-1.06%) |
21.85 |
21.45 - 21.95 |
0.9622 times |
Fri 03 October 2025 |
21.79 (0.23%) |
21.63 |
21.36 - 22.00 |
1.4061 times |
Fri 26 September 2025 |
21.74 (-1%) |
21.79 |
21.59 - 21.80 |
1.7665 times |
Fri 19 September 2025 |
21.96 (-1.61%) |
22.33 |
21.91 - 22.45 |
2.1716 times |
Fri 12 September 2025 |
22.32 (1.82%) |
21.92 |
21.87 - 22.32 |
0.4859 times |
Fri 05 September 2025 |
21.92 (-2.1%) |
22.21 |
21.83 - 22.24 |
0.404 times |
Fri 29 August 2025 |
22.39 (0%) |
22.27 |
22.20 - 22.44 |
0.0786 times |
Fri 29 August 2025 |
22.39 (-0.04%) |
22.49 |
22.15 - 22.50 |
0.5103 times |
Fri 22 August 2025 |
22.40 (0.99%) |
22.14 |
21.90 - 22.50 |
0.4349 times |
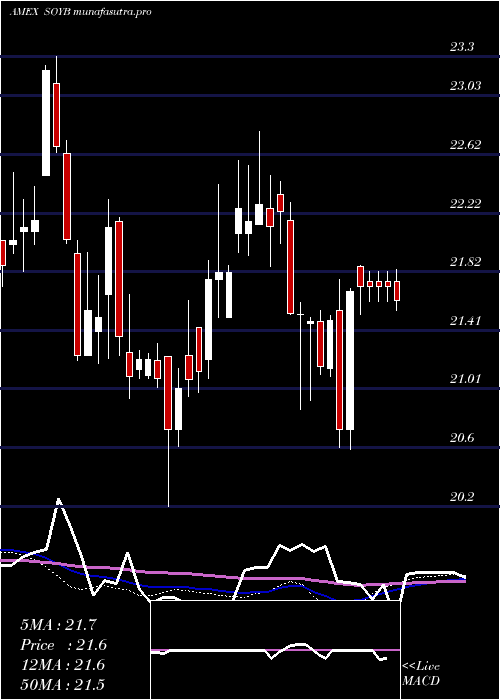
Monthly price and charts TeucriumSoybean Strong monthly Stock price targets for TeucriumSoybean SOYB are 21.81 and 22.74 | Monthly Target 1 | 21.04 | | Monthly Target 2 | 21.64 | | Monthly Target 3 | 21.966666666667 | | Monthly Target 4 | 22.57 | | Monthly Target 5 | 22.9 |
Monthly price and volumes Teucrium Soybean
| Date |
Closing |
Open |
Range |
Volume |
Thu 23 October 2025 |
22.25 (3.68%) |
21.41 |
21.36 - 22.29 |
1.6507 times |
Tue 30 September 2025 |
21.46 (-4.15%) |
22.21 |
21.46 - 22.45 |
1.9832 times |
Fri 29 August 2025 |
22.39 (5.56%) |
21.15 |
21.06 - 22.50 |
0.7552 times |
Thu 31 July 2025 |
21.21 (-2.62%) |
21.74 |
21.17 - 22.33 |
0.7167 times |
Mon 30 June 2025 |
21.78 (0.74%) |
21.72 |
21.32 - 22.65 |
0.9752 times |
Fri 30 May 2025 |
21.62 (0.7%) |
21.50 |
21.43 - 22.35 |
0.6387 times |
Wed 30 April 2025 |
21.47 (0.61%) |
21.35 |
20.59 - 21.99 |
0.716 times |
Mon 31 March 2025 |
21.34 (-0.88%) |
21.52 |
20.87 - 21.65 |
0.5082 times |
Fri 28 February 2025 |
21.53 (-2.84%) |
22.14 |
21.52 - 22.78 |
1.0755 times |
Fri 31 January 2025 |
22.16 (3.17%) |
21.50 |
20.97 - 22.58 |
0.9805 times |
Tue 31 December 2024 |
21.48 (1.27%) |
21.20 |
20.20 - 21.55 |
0.6285 times |

DMA SMA EMA moving averages of Teucrium Soybean SOYB
DMA (daily moving average) of Teucrium Soybean SOYB
| DMA period | DMA value | | 5 day DMA | 22.03 | | 12 day DMA | 21.82 | | 20 day DMA | 21.79 | | 35 day DMA | 21.88 | | 50 day DMA | 21.98 | | 100 day DMA | 21.86 | | 150 day DMA | 21.78 | | 200 day DMA | 21.81 | EMA (exponential moving average) of Teucrium Soybean SOYB
| EMA period | EMA current | EMA prev | EMA prev2 | | 5 day EMA | 22.04 | 21.93 | 21.89 | | 12 day EMA | 21.9 | 21.84 | 21.81 | | 20 day EMA | 21.88 | 21.84 | 21.82 | | 35 day EMA | 21.88 | 21.86 | 21.85 | | 50 day EMA | 21.95 | 21.94 | 21.94 |
SMA (simple moving average) of Teucrium Soybean SOYB
| SMA period | SMA current | SMA prev | SMA prev2 | | 5 day SMA | 22.03 | 21.91 | 21.83 | | 12 day SMA | 21.82 | 21.79 | 21.77 | | 20 day SMA | 21.79 | 21.76 | 21.74 | | 35 day SMA | 21.88 | 21.88 | 21.88 | | 50 day SMA | 21.98 | 21.97 | 21.97 | | 100 day SMA | 21.86 | 21.85 | 21.85 | | 150 day SMA | 21.78 | 21.77 | 21.77 | | 200 day SMA | 21.81 | 21.8 | 21.8 |
|
|
