IndiaSmallcap SMIN full analysis,charts,indicators,moving averages,SMA,DMA,EMA,ADX,MACD,RSIIndia Smallcap SMIN WideScreen charts, DMA,SMA,EMA technical analysis, forecast prediction, by indicators ADX,MACD,RSI,CCI AMEX stock exchange
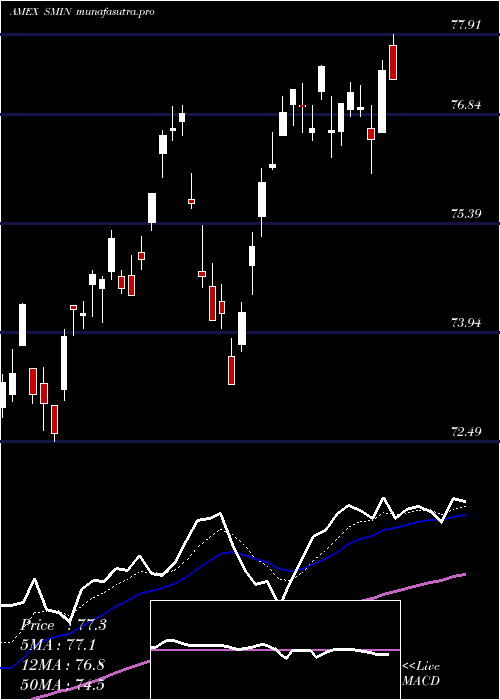
Daily price and charts and targets IndiaSmallcap Strong Daily Stock price targets for IndiaSmallcap SMIN are 74.15 and 74.8 | Daily Target 1 | 74 | | Daily Target 2 | 74.3 | | Daily Target 3 | 74.65 | | Daily Target 4 | 74.95 | | Daily Target 5 | 75.3 |
Daily price and volume India Smallcap
| Date |
Closing |
Open |
Range |
Volume |
Thu 23 October 2025 |
74.60 (-1.49%) |
75.00 |
74.35 - 75.00 |
0.6394 times |
Wed 22 October 2025 |
75.73 (1.95%) |
75.06 |
75.00 - 75.94 |
0.9834 times |
Tue 21 October 2025 |
74.28 (-0.76%) |
74.53 |
74.28 - 74.90 |
0.3557 times |
Mon 20 October 2025 |
74.85 (0.69%) |
74.32 |
74.25 - 74.87 |
1.7951 times |
Fri 17 October 2025 |
74.34 (0.49%) |
73.98 |
73.79 - 74.44 |
0.3603 times |
Thu 16 October 2025 |
73.98 (0.18%) |
74.28 |
73.81 - 74.50 |
0.5871 times |
Wed 15 October 2025 |
73.85 (1.96%) |
73.40 |
73.28 - 73.86 |
0.7077 times |
Tue 14 October 2025 |
72.43 (-0.6%) |
72.35 |
72.11 - 72.80 |
1.0174 times |
Mon 13 October 2025 |
72.87 (0.36%) |
72.93 |
72.67 - 73.20 |
2.5151 times |
Fri 10 October 2025 |
72.61 (-0.15%) |
73.59 |
72.43 - 73.75 |
1.0388 times |
Thu 09 October 2025 |
72.72 (-0.16%) |
72.95 |
72.57 - 73.18 |
0.538 times |
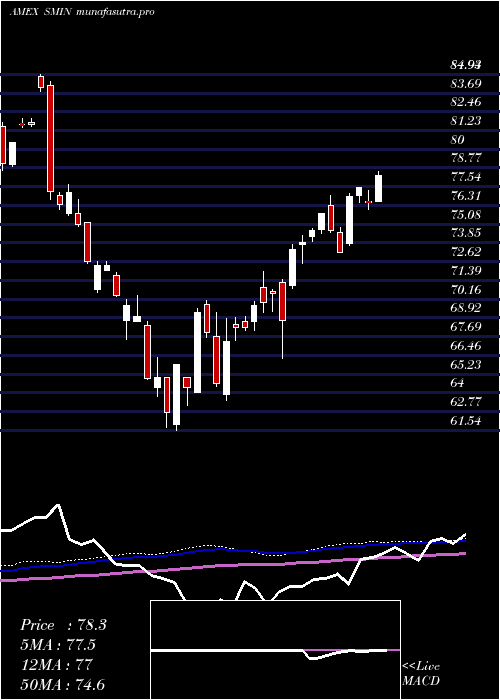
Weekly price and charts IndiaSmallcap Strong weekly Stock price targets for IndiaSmallcap SMIN are 74.43 and 76.12 | Weekly Target 1 | 73.24 | | Weekly Target 2 | 73.92 | | Weekly Target 3 | 74.93 | | Weekly Target 4 | 75.61 | | Weekly Target 5 | 76.62 |
Weekly price and volumes for India Smallcap
| Date |
Closing |
Open |
Range |
Volume |
Thu 23 October 2025 |
74.60 (0.35%) |
74.32 |
74.25 - 75.94 |
1.1244 times |
Fri 17 October 2025 |
74.34 (2.38%) |
72.93 |
72.11 - 74.50 |
1.5457 times |
Fri 10 October 2025 |
72.61 (-0.23%) |
72.99 |
72.43 - 73.75 |
0.9762 times |
Fri 03 October 2025 |
72.78 (1.51%) |
71.62 |
71.58 - 73.00 |
0.696 times |
Fri 26 September 2025 |
71.70 (-4.67%) |
74.49 |
71.51 - 74.53 |
1.8996 times |
Fri 19 September 2025 |
75.21 (2.09%) |
74.20 |
74.16 - 75.65 |
1.0831 times |
Fri 12 September 2025 |
73.67 (1.2%) |
73.11 |
73.04 - 74.45 |
0.51 times |
Fri 05 September 2025 |
72.80 (1.27%) |
72.54 |
72.41 - 73.88 |
0.5632 times |
Fri 29 August 2025 |
71.89 (0%) |
72.14 |
71.62 - 72.23 |
0.3642 times |
Fri 29 August 2025 |
71.89 (-3.94%) |
74.11 |
71.62 - 74.40 |
1.2376 times |
Fri 22 August 2025 |
74.84 (3.01%) |
73.53 |
73.50 - 75.18 |
2.6867 times |
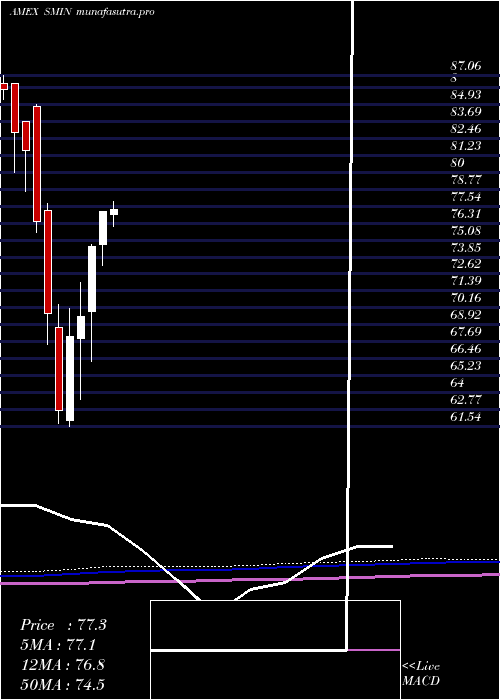
Monthly price and charts IndiaSmallcap Strong monthly Stock price targets for IndiaSmallcap SMIN are 73.3 and 77.24 | Monthly Target 1 | 70.24 | | Monthly Target 2 | 72.42 | | Monthly Target 3 | 74.18 | | Monthly Target 4 | 76.36 | | Monthly Target 5 | 78.12 |
Monthly price and volumes India Smallcap
| Date |
Closing |
Open |
Range |
Volume |
Thu 23 October 2025 |
74.60 (4.02%) |
72.25 |
72.00 - 75.94 |
0.5875 times |
Tue 30 September 2025 |
71.72 (-0.24%) |
72.54 |
71.51 - 75.65 |
0.645 times |
Fri 29 August 2025 |
71.89 (-1.9%) |
73.02 |
71.59 - 75.18 |
0.9443 times |
Thu 31 July 2025 |
73.28 (-5.05%) |
76.96 |
73.14 - 78.54 |
0.9623 times |
Mon 30 June 2025 |
77.18 (3.4%) |
74.75 |
73.25 - 77.18 |
0.6104 times |
Fri 30 May 2025 |
74.64 (7.35%) |
69.92 |
66.24 - 74.77 |
1.0341 times |
Wed 30 April 2025 |
69.53 (2.11%) |
67.95 |
63.48 - 71.98 |
0.9024 times |
Mon 31 March 2025 |
68.09 (8.56%) |
61.94 |
61.54 - 70.10 |
1.4515 times |
Fri 28 February 2025 |
62.72 (-10.07%) |
68.72 |
61.73 - 70.39 |
1.3396 times |
Fri 31 January 2025 |
69.74 (-8.78%) |
77.26 |
67.51 - 77.71 |
1.5231 times |
Tue 31 December 2024 |
76.45 (-6.32%) |
84.77 |
75.62 - 84.94 |
0.4958 times |
DMA SMA EMA moving averages of India Smallcap SMIN
DMA (daily moving average) of India Smallcap SMIN
| DMA period | DMA value | | 5 day DMA | 74.76 | | 12 day DMA | 73.76 | | 20 day DMA | 73.22 | | 35 day DMA | 73.49 | | 50 day DMA | 73.49 | | 100 day DMA | 74.38 | | 150 day DMA | 72.91 | | 200 day DMA | 71.65 | EMA (exponential moving average) of India Smallcap SMIN
| EMA period | EMA current | EMA prev | EMA prev2 | | 5 day EMA | 74.65 | 74.68 | 74.15 | | 12 day EMA | 74.05 | 73.95 | 73.63 | | 20 day EMA | 73.75 | 73.66 | 73.44 | | 35 day EMA | 73.5 | 73.44 | 73.31 | | 50 day EMA | 73.5 | 73.46 | 73.37 |
SMA (simple moving average) of India Smallcap SMIN
| SMA period | SMA current | SMA prev | SMA prev2 | | 5 day SMA | 74.76 | 74.64 | 74.26 | | 12 day SMA | 73.76 | 73.65 | 73.4 | | 20 day SMA | 73.22 | 73.11 | 72.96 | | 35 day SMA | 73.49 | 73.45 | 73.39 | | 50 day SMA | 73.49 | 73.44 | 73.38 | | 100 day SMA | 74.38 | 74.38 | 74.37 | | 150 day SMA | 72.91 | 72.85 | 72.78 | | 200 day SMA | 71.65 | 71.66 | 71.66 |
|
|
