SlIndustries SLI full analysis,charts,indicators,moving averages,SMA,DMA,EMA,ADX,MACD,RSISl Industries SLI WideScreen charts, DMA,SMA,EMA technical analysis, forecast prediction, by indicators ADX,MACD,RSI,CCI AMEX stock exchange
Daily price and charts and targets SlIndustries Strong Daily Stock price targets for SlIndustries SLI are 4.42 and 4.71 | Daily Target 1 | 4.36 | | Daily Target 2 | 4.47 | | Daily Target 3 | 4.6533333333333 | | Daily Target 4 | 4.76 | | Daily Target 5 | 4.94 |
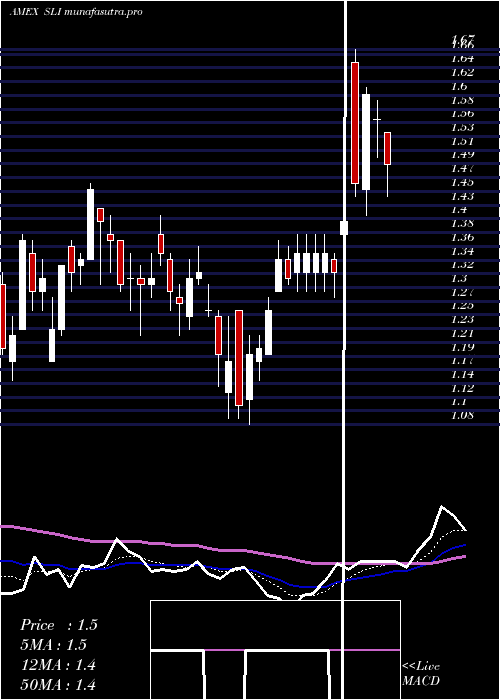
Daily price and volume Sl Industries
| Date |
Closing |
Open |
Range |
Volume |
Fri 05 December 2025 |
4.57 (-3.38%) |
4.74 |
4.55 - 4.84 |
0.8807 times |
Thu 04 December 2025 |
4.73 (2.83%) |
4.46 |
4.46 - 4.79 |
1.3725 times |
Wed 03 December 2025 |
4.60 (2.91%) |
4.47 |
4.27 - 4.70 |
1.4616 times |
Tue 02 December 2025 |
4.47 (5.92%) |
4.16 |
4.13 - 4.48 |
1.2939 times |
Mon 01 December 2025 |
4.22 (0.72%) |
4.03 |
4.02 - 4.38 |
1.1181 times |
Fri 28 November 2025 |
4.19 (1.7%) |
4.13 |
4.08 - 4.26 |
0.5309 times |
Wed 26 November 2025 |
4.12 (4.3%) |
4.08 |
3.98 - 4.12 |
0.5094 times |
Tue 25 November 2025 |
3.95 (0.25%) |
3.95 |
3.78 - 4.00 |
0.6165 times |
Mon 24 November 2025 |
3.94 (4.23%) |
3.83 |
3.73 - 3.95 |
0.831 times |
Fri 21 November 2025 |
3.78 (-1.56%) |
3.73 |
3.55 - 3.84 |
1.3853 times |
Thu 20 November 2025 |
3.84 (-6.11%) |
4.36 |
3.77 - 4.42 |
2.2741 times |
Weekly price and charts SlIndustries Strong weekly Stock price targets for SlIndustries SLI are 4.3 and 5.12 | Weekly Target 1 | 3.66 | | Weekly Target 2 | 4.11 | | Weekly Target 3 | 4.4766666666667 | | Weekly Target 4 | 4.93 | | Weekly Target 5 | 5.3 |
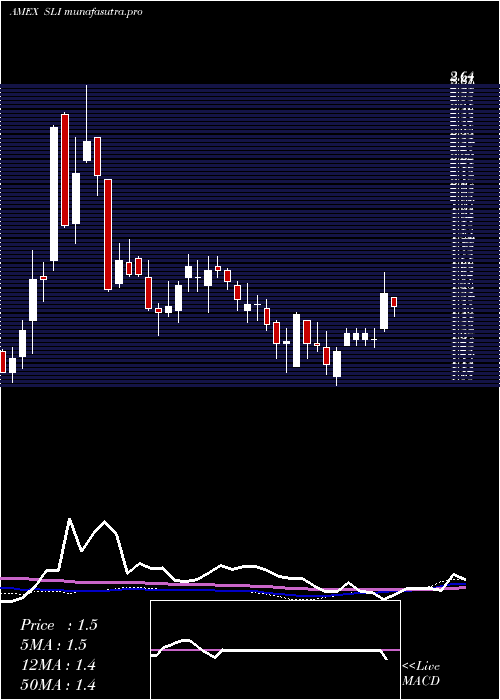
Weekly price and volumes for Sl Industries
| Date |
Closing |
Open |
Range |
Volume |
Fri 05 December 2025 |
4.57 (9.07%) |
4.03 |
4.02 - 4.84 |
0.6283 times |
Fri 28 November 2025 |
4.19 (10.85%) |
3.83 |
3.73 - 4.26 |
0.2551 times |
Fri 21 November 2025 |
3.78 (15.95%) |
3.61 |
3.20 - 4.42 |
1.132 times |
Fri 14 November 2025 |
3.26 (-2.69%) |
3.42 |
2.91 - 3.60 |
0.802 times |
Fri 07 November 2025 |
3.35 (-11.38%) |
3.30 |
3.15 - 3.52 |
0.5911 times |
Fri 31 October 2025 |
3.78 (0%) |
3.99 |
3.70 - 4.01 |
0.1133 times |
Fri 31 October 2025 |
3.78 (-10.64%) |
4.11 |
3.51 - 4.14 |
0.8568 times |
Fri 24 October 2025 |
4.23 (-1.63%) |
4.45 |
3.78 - 4.76 |
1.2182 times |
Fri 17 October 2025 |
4.30 (-4.66%) |
4.76 |
3.85 - 6.40 |
3.334 times |
Fri 10 October 2025 |
4.51 (10%) |
4.25 |
4.02 - 4.92 |
1.0691 times |
Fri 03 October 2025 |
4.10 (9.33%) |
3.84 |
3.26 - 4.26 |
0.9465 times |
Monthly price and charts SlIndustries Strong monthly Stock price targets for SlIndustries SLI are 4.3 and 5.12 | Monthly Target 1 | 3.66 | | Monthly Target 2 | 4.11 | | Monthly Target 3 | 4.4766666666667 | | Monthly Target 4 | 4.93 | | Monthly Target 5 | 5.3 |
Monthly price and volumes Sl Industries
| Date |
Closing |
Open |
Range |
Volume |
Fri 05 December 2025 |
4.57 (9.07%) |
4.03 |
4.02 - 4.84 |
0.2611 times |
Fri 28 November 2025 |
4.19 (10.85%) |
3.30 |
2.91 - 4.42 |
1.1552 times |
Fri 31 October 2025 |
3.78 (12.17%) |
3.50 |
3.50 - 6.40 |
2.9935 times |
Tue 30 September 2025 |
3.37 (14.63%) |
2.82 |
2.74 - 4.08 |
1.1661 times |
Fri 29 August 2025 |
2.94 (24.05%) |
2.27 |
2.20 - 3.13 |
0.6275 times |
Thu 31 July 2025 |
2.37 (20.92%) |
1.96 |
1.92 - 2.95 |
0.9627 times |
Mon 30 June 2025 |
1.96 (18.79%) |
1.69 |
1.49 - 1.99 |
0.6309 times |
Fri 30 May 2025 |
1.65 (11.49%) |
1.47 |
1.37 - 1.94 |
0.7148 times |
Wed 30 April 2025 |
1.48 (16.54%) |
1.25 |
1.08 - 1.67 |
1.0782 times |
Mon 31 March 2025 |
1.27 (-2.31%) |
1.30 |
1.15 - 1.46 |
0.41 times |
Fri 28 February 2025 |
1.30 (-15.03%) |
1.47 |
1.22 - 1.61 |
0.3567 times |

DMA SMA EMA moving averages of Sl Industries SLI
DMA (daily moving average) of Sl Industries SLI
| DMA period | DMA value | | 5 day DMA | 4.52 | | 12 day DMA | 4.21 | | 20 day DMA | 3.88 | | 35 day DMA | 3.88 | | 50 day DMA | 4.01 | | 100 day DMA | 3.42 | | 150 day DMA | 2.9 | | 200 day DMA | 2.51 | EMA (exponential moving average) of Sl Industries SLI
| EMA period | EMA current | EMA prev | EMA prev2 | | 5 day EMA | 4.51 | 4.48 | 4.35 | | 12 day EMA | 4.25 | 4.19 | 4.09 | | 20 day EMA | 4.09 | 4.04 | 3.97 | | 35 day EMA | 4 | 3.97 | 3.92 | | 50 day EMA | 4 | 3.98 | 3.95 |
SMA (simple moving average) of Sl Industries SLI
| SMA period | SMA current | SMA prev | SMA prev2 | | 5 day SMA | 4.52 | 4.44 | 4.32 | | 12 day SMA | 4.21 | 4.13 | 4.03 | | 20 day SMA | 3.88 | 3.81 | 3.74 | | 35 day SMA | 3.88 | 3.9 | 3.91 | | 50 day SMA | 4.01 | 4 | 3.97 | | 100 day SMA | 3.42 | 3.4 | 3.38 | | 150 day SMA | 2.9 | 2.88 | 2.86 | | 200 day SMA | 2.51 | 2.49 | 2.48 |
|
|
