PhysicalSilver SIVR full analysis,charts,indicators,moving averages,SMA,DMA,EMA,ADX,MACD,RSIPhysical Silver SIVR WideScreen charts, DMA,SMA,EMA technical analysis, forecast prediction, by indicators ADX,MACD,RSI,CCI AMEX stock exchange
Daily price and charts and targets PhysicalSilver Strong Daily Stock price targets for PhysicalSilver SIVR are 46.27 and 47.28 | Daily Target 1 | 45.55 | | Daily Target 2 | 45.98 | | Daily Target 3 | 46.556666666667 | | Daily Target 4 | 46.99 | | Daily Target 5 | 47.57 |
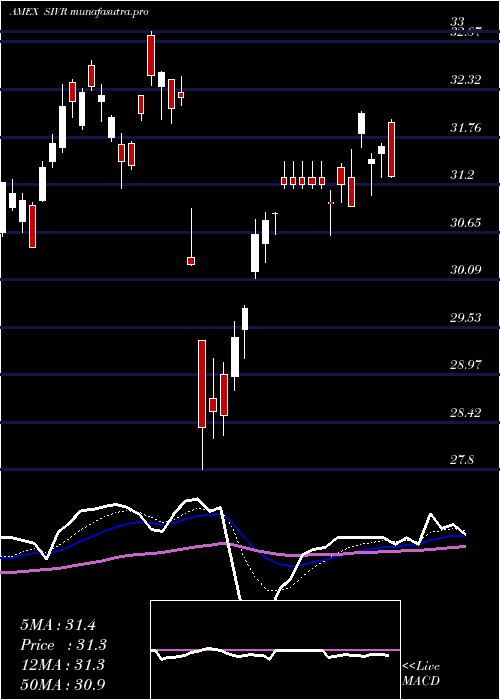
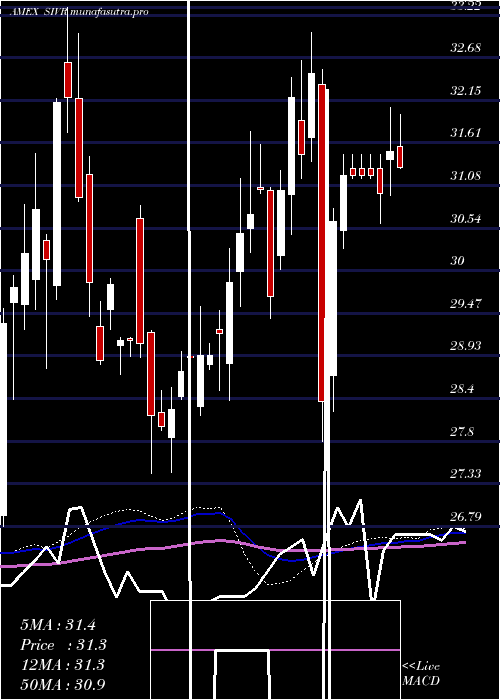
Daily price and volume Physical Silver
| Date |
Closing |
Open |
Range |
Volume |
Thu 23 October 2025 |
46.42 (0.65%) |
46.40 |
46.12 - 47.13 |
0.3986 times |
Wed 22 October 2025 |
46.12 (0.22%) |
46.80 |
45.40 - 46.80 |
0.5486 times |
Tue 21 October 2025 |
46.02 (-8.11%) |
47.38 |
45.50 - 47.60 |
2.0916 times |
Mon 20 October 2025 |
50.08 (1.58%) |
49.03 |
49.03 - 50.36 |
0.5456 times |
Fri 17 October 2025 |
49.30 (-4.38%) |
51.60 |
48.14 - 51.75 |
0.9656 times |
Thu 16 October 2025 |
51.56 (1.76%) |
50.41 |
50.10 - 52.00 |
0.7635 times |
Wed 15 October 2025 |
50.67 (3.22%) |
50.16 |
49.80 - 50.73 |
0.9037 times |
Tue 14 October 2025 |
49.09 (-1.23%) |
48.66 |
48.13 - 49.58 |
0.8893 times |
Mon 13 October 2025 |
49.70 (4.61%) |
49.50 |
49.09 - 49.81 |
1.0331 times |
Fri 10 October 2025 |
47.51 (1.41%) |
47.67 |
47.26 - 48.31 |
1.8604 times |
Thu 09 October 2025 |
46.85 (0.24%) |
48.26 |
45.43 - 48.29 |
1.4618 times |
Weekly price and charts PhysicalSilver Strong weekly Stock price targets for PhysicalSilver SIVR are 43.43 and 48.39 | Weekly Target 1 | 42.43 | | Weekly Target 2 | 44.43 | | Weekly Target 3 | 47.393333333333 | | Weekly Target 4 | 49.39 | | Weekly Target 5 | 52.35 |
Weekly price and volumes for Physical Silver
| Date |
Closing |
Open |
Range |
Volume |
Thu 23 October 2025 |
46.42 (-5.84%) |
49.03 |
45.40 - 50.36 |
1.2677 times |
Fri 17 October 2025 |
49.30 (3.77%) |
49.50 |
48.13 - 52.00 |
1.611 times |
Fri 10 October 2025 |
47.51 (3.94%) |
46.38 |
45.08 - 48.31 |
1.9276 times |
Fri 03 October 2025 |
45.71 (4.03%) |
44.56 |
43.58 - 46.20 |
1.2921 times |
Fri 26 September 2025 |
43.94 (7.25%) |
41.45 |
41.30 - 44.42 |
0.8414 times |
Fri 19 September 2025 |
40.97 (1.86%) |
40.21 |
39.21 - 41.05 |
0.9572 times |
Fri 12 September 2025 |
40.22 (3%) |
39.43 |
38.85 - 40.33 |
0.6014 times |
Fri 05 September 2025 |
39.05 (2.9%) |
38.45 |
38.24 - 39.49 |
0.6014 times |
Fri 29 August 2025 |
37.95 (0%) |
37.08 |
37.08 - 38.08 |
0.1603 times |
Fri 29 August 2025 |
37.95 (2.37%) |
36.80 |
36.33 - 38.09 |
0.7399 times |
Fri 22 August 2025 |
37.07 (2.43%) |
36.37 |
35.51 - 37.22 |
0.6334 times |
Monthly price and charts PhysicalSilver Strong monthly Stock price targets for PhysicalSilver SIVR are 45.07 and 53.35 | Monthly Target 1 | 39.1 | | Monthly Target 2 | 42.76 | | Monthly Target 3 | 47.38 | | Monthly Target 4 | 51.04 | | Monthly Target 5 | 55.66 |
Monthly price and volumes Physical Silver
| Date |
Closing |
Open |
Range |
Volume |
Thu 23 October 2025 |
46.42 (4.36%) |
45.18 |
43.72 - 52.00 |
2.0783 times |
Tue 30 September 2025 |
44.48 (17.21%) |
38.45 |
38.24 - 44.86 |
1.2448 times |
Fri 29 August 2025 |
37.95 (8.55%) |
35.44 |
35.04 - 38.09 |
1.0877 times |
Thu 31 July 2025 |
34.96 (1.6%) |
34.55 |
34.32 - 37.67 |
1.157 times |
Mon 30 June 2025 |
34.41 (9.41%) |
32.37 |
32.22 - 35.51 |
1.1283 times |
Fri 30 May 2025 |
31.45 (1.29%) |
30.87 |
30.34 - 32.01 |
0.6066 times |
Wed 30 April 2025 |
31.05 (-4.49%) |
32.43 |
27.86 - 32.47 |
0.965 times |
Mon 31 March 2025 |
32.51 (9.54%) |
30.20 |
30.02 - 33.00 |
0.6047 times |
Fri 28 February 2025 |
29.68 (-0.6%) |
30.00 |
29.40 - 31.75 |
0.5869 times |
Fri 31 January 2025 |
29.86 (8.31%) |
28.00 |
27.99 - 30.29 |
0.5406 times |
Tue 31 December 2024 |
27.57 (-5.32%) |
30.66 |
27.45 - 30.82 |
0.6458 times |

DMA SMA EMA moving averages of Physical Silver SIVR
DMA (daily moving average) of Physical Silver SIVR
| DMA period | DMA value | | 5 day DMA | 47.59 | | 12 day DMA | 48.34 | | 20 day DMA | 47.01 | | 35 day DMA | 44.21 | | 50 day DMA | 42.1 | | 100 day DMA | 38.73 | | 150 day DMA | 36.18 | | 200 day DMA | 34.73 | EMA (exponential moving average) of Physical Silver SIVR
| EMA period | EMA current | EMA prev | EMA prev2 | | 5 day EMA | 47.29 | 47.73 | 48.53 | | 12 day EMA | 47.49 | 47.69 | 47.97 | | 20 day EMA | 46.6 | 46.62 | 46.67 | | 35 day EMA | 44.56 | 44.45 | 44.35 | | 50 day EMA | 42.15 | 41.98 | 41.81 |
SMA (simple moving average) of Physical Silver SIVR
| SMA period | SMA current | SMA prev | SMA prev2 | | 5 day SMA | 47.59 | 48.62 | 49.53 | | 12 day SMA | 48.34 | 48.26 | 48.28 | | 20 day SMA | 47.01 | 46.85 | 46.63 | | 35 day SMA | 44.21 | 43.99 | 43.79 | | 50 day SMA | 42.1 | 41.9 | 41.71 | | 100 day SMA | 38.73 | 38.59 | 38.44 | | 150 day SMA | 36.18 | 36.09 | 35.99 | | 200 day SMA | 34.73 | 34.64 | 34.55 |
|
|
