GrupoSimec SIM full analysis,charts,indicators,moving averages,SMA,DMA,EMA,ADX,MACD,RSIGrupo Simec SIM WideScreen charts, DMA,SMA,EMA technical analysis, forecast prediction, by indicators ADX,MACD,RSI,CCI AMEX stock exchange
Daily price and charts and targets GrupoSimec Strong Daily Stock price targets for GrupoSimec SIM are 26.48 and 27.49 | Daily Target 1 | 26.31 | | Daily Target 2 | 26.64 | | Daily Target 3 | 27.316666666667 | | Daily Target 4 | 27.65 | | Daily Target 5 | 28.33 |
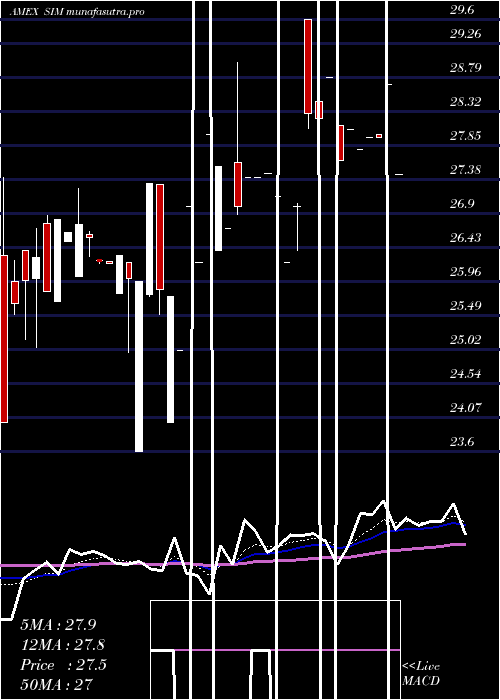
Daily price and volume Grupo Simec
| Date |
Closing |
Open |
Range |
Volume |
Tue 21 October 2025 |
26.98 (-0.77%) |
27.99 |
26.98 - 27.99 |
1.0997 times |
Mon 20 October 2025 |
27.19 (0.7%) |
27.19 |
27.19 - 27.19 |
0.11 times |
Mon 13 October 2025 |
27.00 (-2%) |
27.01 |
27.00 - 27.01 |
2.8593 times |
Fri 10 October 2025 |
27.55 (2.8%) |
27.89 |
27.00 - 28.06 |
2.1995 times |
Wed 08 October 2025 |
26.80 (-0.92%) |
26.84 |
26.80 - 26.85 |
1.2097 times |
Fri 03 October 2025 |
27.05 (7.34%) |
28.20 |
27.05 - 28.20 |
0.2562 times |
Thu 02 October 2025 |
25.20 (-10%) |
25.20 |
25.20 - 25.20 |
0.8358 times |
Mon 29 September 2025 |
28.00 (0.29%) |
28.00 |
28.00 - 28.00 |
1.0997 times |
Fri 26 September 2025 |
27.92 (0.22%) |
27.92 |
27.92 - 27.92 |
0.11 times |
Wed 24 September 2025 |
27.86 (-1.17%) |
27.86 |
27.86 - 27.86 |
0.2199 times |
Tue 23 September 2025 |
28.19 (0.25%) |
28.62 |
28.18 - 28.62 |
1.4297 times |
Weekly price and charts GrupoSimec Strong weekly Stock price targets for GrupoSimec SIM are 26.48 and 27.49 | Weekly Target 1 | 26.31 | | Weekly Target 2 | 26.64 | | Weekly Target 3 | 27.316666666667 | | Weekly Target 4 | 27.65 | | Weekly Target 5 | 28.33 |
Weekly price and volumes for Grupo Simec
| Date |
Closing |
Open |
Range |
Volume |
Tue 21 October 2025 |
26.98 (-0.07%) |
27.19 |
26.98 - 27.99 |
0.5853 times |
Mon 13 October 2025 |
27.00 (-2%) |
27.01 |
27.00 - 27.01 |
1.3835 times |
Fri 10 October 2025 |
27.55 (1.85%) |
26.84 |
26.80 - 28.06 |
1.6496 times |
Fri 03 October 2025 |
27.05 (-3.12%) |
28.00 |
25.20 - 28.20 |
1.0605 times |
Fri 26 September 2025 |
27.92 (-0.71%) |
28.62 |
27.86 - 28.62 |
0.8514 times |
Fri 19 September 2025 |
28.12 (0.21%) |
27.33 |
27.33 - 28.18 |
0.745 times |
Thu 11 September 2025 |
28.06 (0.36%) |
25.00 |
25.00 - 28.06 |
0.7982 times |
Wed 13 August 2025 |
27.96 (0.61%) |
26.76 |
26.76 - 27.96 |
1.0642 times |
Thu 07 August 2025 |
27.79 (1.24%) |
27.50 |
27.50 - 27.79 |
0.5321 times |
Fri 01 August 2025 |
27.45 (-1.82%) |
28.70 |
27.45 - 28.70 |
1.3303 times |
Fri 25 July 2025 |
27.96 (0.61%) |
27.96 |
27.96 - 28.00 |
0.4257 times |

Monthly price and charts GrupoSimec Strong monthly Stock price targets for GrupoSimec SIM are 26.09 and 29.09 | Monthly Target 1 | 23.79 | | Monthly Target 2 | 25.39 | | Monthly Target 3 | 26.793333333333 | | Monthly Target 4 | 28.39 | | Monthly Target 5 | 29.79 |
Monthly price and volumes Grupo Simec
| Date |
Closing |
Open |
Range |
Volume |
Tue 21 October 2025 |
26.98 (-3.64%) |
25.20 |
25.20 - 28.20 |
0.4541 times |
Mon 29 September 2025 |
28.00 (0.14%) |
25.00 |
25.00 - 28.62 |
0.3205 times |
Wed 13 August 2025 |
27.96 (-2.58%) |
27.45 |
26.76 - 27.96 |
0.2739 times |
Tue 29 July 2025 |
28.70 (6.3%) |
29.60 |
27.65 - 29.60 |
0.5698 times |
Mon 30 June 2025 |
27.00 (-1.46%) |
27.40 |
26.23 - 27.47 |
1.4567 times |
Thu 29 May 2025 |
27.40 (-2.14%) |
26.40 |
26.40 - 29.00 |
0.1224 times |
Thu 24 April 2025 |
28.00 (6.83%) |
25.80 |
23.60 - 28.00 |
0.4169 times |
Mon 31 March 2025 |
26.21 (2.82%) |
26.73 |
24.00 - 27.40 |
3.6069 times |
Fri 28 February 2025 |
25.49 (0.43%) |
24.37 |
22.15 - 26.63 |
0.9556 times |
Thu 30 January 2025 |
25.38 (-6.52%) |
25.50 |
25.00 - 28.34 |
1.8231 times |
Fri 27 December 2024 |
27.15 (5.36%) |
27.56 |
25.00 - 31.00 |
0.594 times |

DMA SMA EMA moving averages of Grupo Simec SIM
DMA (daily moving average) of Grupo Simec SIM
| DMA period | DMA value | | 5 day DMA | 27.1 | | 12 day DMA | 27.32 | | 20 day DMA | 27.34 | | 35 day DMA | 27.51 | | 50 day DMA | 27.2 | | 100 day DMA | 26.64 | | 150 day DMA | 26.94 | | 200 day DMA | 27.87 | EMA (exponential moving average) of Grupo Simec SIM
| EMA period | EMA current | EMA prev | EMA prev2 | | 5 day EMA | 27.08 | 27.13 | 27.1 | | 12 day EMA | 27.2 | 27.24 | 27.25 | | 20 day EMA | 27.28 | 27.31 | 27.32 | | 35 day EMA | 27.21 | 27.22 | 27.22 | | 50 day EMA | 27.13 | 27.14 | 27.14 |
SMA (simple moving average) of Grupo Simec SIM
| SMA period | SMA current | SMA prev | SMA prev2 | | 5 day SMA | 27.1 | 27.12 | 26.72 | | 12 day SMA | 27.32 | 27.35 | 27.42 | | 20 day SMA | 27.34 | 27.42 | 27.46 | | 35 day SMA | 27.51 | 27.51 | 27.5 | | 50 day SMA | 27.2 | 27.19 | 27.18 | | 100 day SMA | 26.64 | 26.64 | 26.63 | | 150 day SMA | 26.94 | 26.95 | 26.95 | | 200 day SMA | 27.87 | 27.89 | 27.91 |
|
|
