UltrashortIndustrials SIJ full analysis,charts,indicators,moving averages,SMA,DMA,EMA,ADX,MACD,RSIUltrashort Industrials SIJ WideScreen charts, DMA,SMA,EMA technical analysis, forecast prediction, by indicators ADX,MACD,RSI,CCI AMEX stock exchange
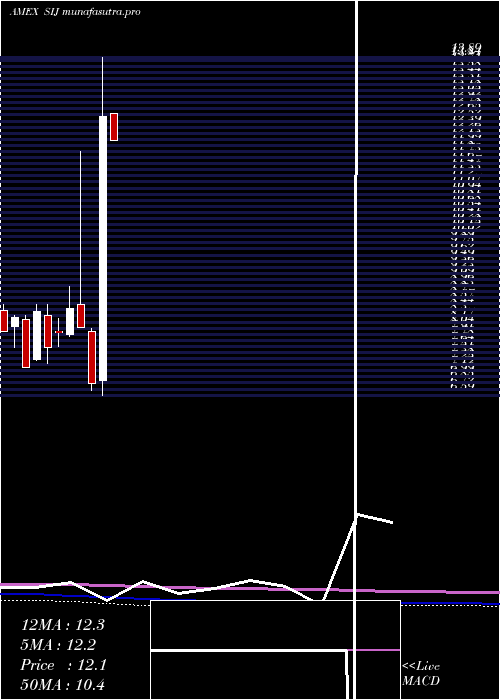
Daily price and charts and targets UltrashortIndustrials Strong Daily Stock price targets for UltrashortIndustrials SIJ are 11.46 and 11.61 | Daily Target 1 | 11.42 | | Daily Target 2 | 11.49 | | Daily Target 3 | 11.573333333333 | | Daily Target 4 | 11.64 | | Daily Target 5 | 11.72 |
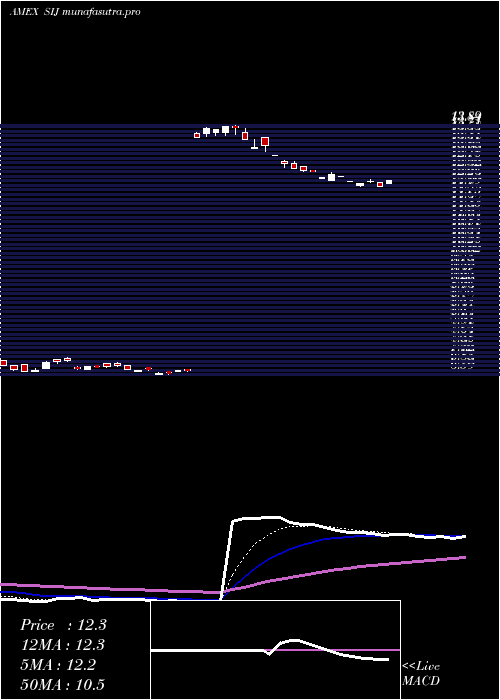
Daily price and volume Ultrashort Industrials
| Date |
Closing |
Open |
Range |
Volume |
Thu 23 October 2025 |
11.55 (-1.7%) |
11.66 |
11.51 - 11.66 |
0.6567 times |
Wed 22 October 2025 |
11.75 (2.53%) |
11.43 |
11.43 - 11.82 |
0.6703 times |
Tue 21 October 2025 |
11.46 (-1.72%) |
11.41 |
11.41 - 11.46 |
0.3782 times |
Mon 20 October 2025 |
11.66 (-2.26%) |
12.00 |
11.66 - 12.00 |
1.1898 times |
Fri 17 October 2025 |
11.93 (-0.33%) |
11.99 |
11.93 - 12.06 |
0.5673 times |
Thu 16 October 2025 |
11.97 (1.27%) |
11.70 |
11.70 - 12.09 |
3.2959 times |
Wed 15 October 2025 |
11.82 (1.03%) |
11.55 |
11.55 - 11.91 |
1.3778 times |
Tue 14 October 2025 |
11.70 (-2.34%) |
11.88 |
11.64 - 11.88 |
0.9726 times |
Mon 13 October 2025 |
11.98 (3.63%) |
12.03 |
11.92 - 12.06 |
0.4593 times |
Tue 07 October 2025 |
11.56 (1.23%) |
11.44 |
11.44 - 11.56 |
0.4322 times |
Mon 06 October 2025 |
11.42 (-0.95%) |
11.49 |
11.42 - 11.49 |
0.406 times |
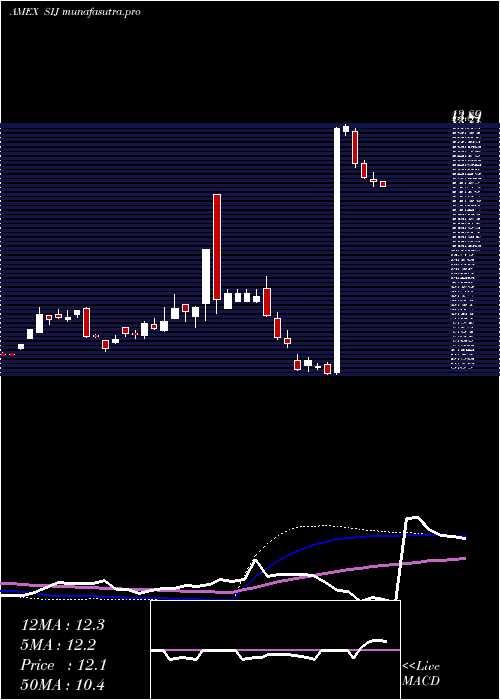
Weekly price and charts UltrashortIndustrials Strong weekly Stock price targets for UltrashortIndustrials SIJ are 11.19 and 11.78 | Weekly Target 1 | 11.06 | | Weekly Target 2 | 11.31 | | Weekly Target 3 | 11.653333333333 | | Weekly Target 4 | 11.9 | | Weekly Target 5 | 12.24 |
Weekly price and volumes for Ultrashort Industrials
| Date |
Closing |
Open |
Range |
Volume |
Thu 23 October 2025 |
11.55 (-3.19%) |
12.00 |
11.41 - 12.00 |
0.637 times |
Fri 17 October 2025 |
11.93 (3.2%) |
12.03 |
11.55 - 12.09 |
1.4682 times |
Tue 07 October 2025 |
11.56 (0.26%) |
11.49 |
11.42 - 11.56 |
0.1845 times |
Fri 03 October 2025 |
11.53 (-2.21%) |
11.71 |
11.41 - 12.10 |
3.6682 times |
Fri 26 September 2025 |
11.79 (-1.17%) |
12.03 |
11.78 - 12.03 |
0.4161 times |
Fri 19 September 2025 |
11.93 (-1.81%) |
12.09 |
11.90 - 12.25 |
0.5825 times |
Fri 12 September 2025 |
12.15 (-0.82%) |
12.39 |
11.88 - 12.51 |
1.6168 times |
Fri 05 September 2025 |
12.25 (2.34%) |
12.33 |
12.16 - 12.50 |
0.6479 times |
Fri 29 August 2025 |
11.97 (0%) |
11.83 |
11.83 - 12.11 |
0.1486 times |
Fri 29 August 2025 |
11.97 (0.76%) |
12.40 |
11.71 - 12.40 |
0.6301 times |
Fri 22 August 2025 |
11.88 (-3.34%) |
12.25 |
11.68 - 12.34 |
0.3864 times |
Monthly price and charts UltrashortIndustrials Strong monthly Stock price targets for UltrashortIndustrials SIJ are 11.14 and 11.82 | Monthly Target 1 | 11 | | Monthly Target 2 | 11.28 | | Monthly Target 3 | 11.683333333333 | | Monthly Target 4 | 11.96 | | Monthly Target 5 | 12.36 |
Monthly price and volumes Ultrashort Industrials
| Date |
Closing |
Open |
Range |
Volume |
Thu 23 October 2025 |
11.55 (0.09%) |
11.62 |
11.41 - 12.09 |
0.3955 times |
Tue 30 September 2025 |
11.54 (-3.59%) |
12.33 |
11.54 - 12.51 |
0.4959 times |
Fri 29 August 2025 |
11.97 (-0.5%) |
13.51 |
11.68 - 13.51 |
0.3971 times |
Thu 31 July 2025 |
12.03 (-4.68%) |
12.69 |
11.51 - 12.69 |
0.4151 times |
Mon 30 June 2025 |
12.62 (84.5%) |
6.91 |
6.59 - 13.89 |
0.3208 times |
Fri 30 May 2025 |
6.84 (-15.03%) |
7.96 |
6.68 - 8.03 |
1.1522 times |
Wed 30 April 2025 |
8.05 (-4.85%) |
8.55 |
8.05 - 11.86 |
3.6901 times |
Mon 31 March 2025 |
8.46 (6.42%) |
7.90 |
7.85 - 8.93 |
1.6219 times |
Fri 28 February 2025 |
7.95 (4.33%) |
7.97 |
7.64 - 8.25 |
0.6373 times |
Fri 31 January 2025 |
7.62 (-9.29%) |
8.32 |
7.27 - 8.55 |
0.874 times |
Tue 31 December 2024 |
8.40 (16.99%) |
7.35 |
7.34 - 8.55 |
0.4807 times |
DMA SMA EMA moving averages of Ultrashort Industrials SIJ
DMA (daily moving average) of Ultrashort Industrials SIJ
| DMA period | DMA value | | 5 day DMA | 11.67 | | 12 day DMA | 11.69 | | 20 day DMA | 11.71 | | 35 day DMA | 11.9 | | 50 day DMA | 11.94 | | 100 day DMA | 11.58 | | 150 day DMA | 10.45 | | 200 day DMA | 9.83 | EMA (exponential moving average) of Ultrashort Industrials SIJ
| EMA period | EMA current | EMA prev | EMA prev2 | | 5 day EMA | 11.65 | 11.7 | 11.68 | | 12 day EMA | 11.7 | 11.73 | 11.73 | | 20 day EMA | 11.77 | 11.79 | 11.79 | | 35 day EMA | 11.83 | 11.85 | 11.86 | | 50 day EMA | 11.93 | 11.95 | 11.96 |
SMA (simple moving average) of Ultrashort Industrials SIJ
| SMA period | SMA current | SMA prev | SMA prev2 | | 5 day SMA | 11.67 | 11.75 | 11.77 | | 12 day SMA | 11.69 | 11.7 | 11.68 | | 20 day SMA | 11.71 | 11.73 | 11.74 | | 35 day SMA | 11.9 | 11.91 | 11.92 | | 50 day SMA | 11.94 | 11.95 | 11.96 | | 100 day SMA | 11.58 | 11.53 | 11.48 | | 150 day SMA | 10.45 | 10.43 | 10.41 | | 200 day SMA | 9.83 | 9.81 | 9.8 |
|
|
