SifcoIndustries SIF full analysis,charts,indicators,moving averages,SMA,DMA,EMA,ADX,MACD,RSISifco Industries SIF WideScreen charts, DMA,SMA,EMA technical analysis, forecast prediction, by indicators ADX,MACD,RSI,CCI AMEX stock exchange
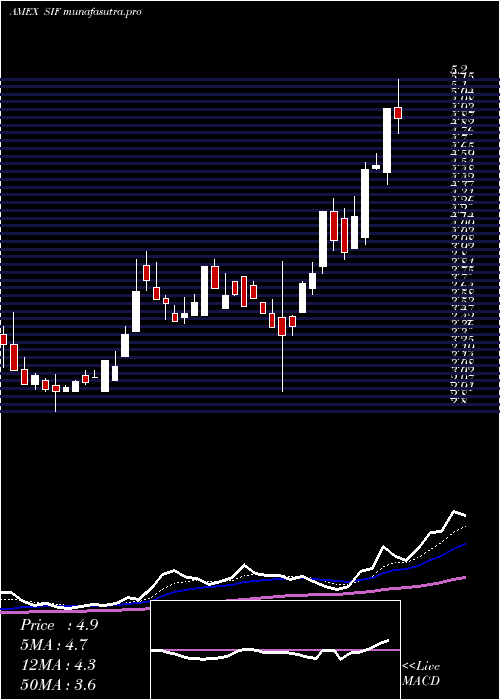
Daily price and charts and targets SifcoIndustries Strong Daily Stock price targets for SifcoIndustries SIF are 6.92 and 7.26 | Daily Target 1 | 6.66 | | Daily Target 2 | 6.84 | | Daily Target 3 | 6.9966666666667 | | Daily Target 4 | 7.18 | | Daily Target 5 | 7.34 |
Daily price and volume Sifco Industries
| Date |
Closing |
Open |
Range |
Volume |
Thu 23 October 2025 |
7.03 (0.86%) |
6.81 |
6.81 - 7.15 |
0.7783 times |
Wed 22 October 2025 |
6.97 (3.87%) |
6.57 |
6.54 - 7.00 |
0.8957 times |
Tue 21 October 2025 |
6.71 (1.51%) |
6.60 |
6.60 - 6.82 |
0.4159 times |
Mon 20 October 2025 |
6.61 (-0.75%) |
6.88 |
6.59 - 6.88 |
0.3216 times |
Fri 17 October 2025 |
6.66 (-7.76%) |
7.00 |
6.57 - 7.02 |
1.2471 times |
Thu 16 October 2025 |
7.22 (-1.77%) |
7.32 |
7.00 - 7.32 |
0.3962 times |
Wed 15 October 2025 |
7.35 (4.4%) |
7.23 |
7.06 - 7.50 |
3.2113 times |
Tue 14 October 2025 |
7.04 (-0.42%) |
6.86 |
6.85 - 7.24 |
0.8086 times |
Mon 13 October 2025 |
7.07 (2.46%) |
6.90 |
6.90 - 7.23 |
0.4313 times |
Fri 10 October 2025 |
6.90 (-5.87%) |
7.33 |
6.83 - 7.44 |
1.494 times |
Thu 09 October 2025 |
7.33 (-0.81%) |
7.40 |
7.28 - 7.45 |
1.263 times |
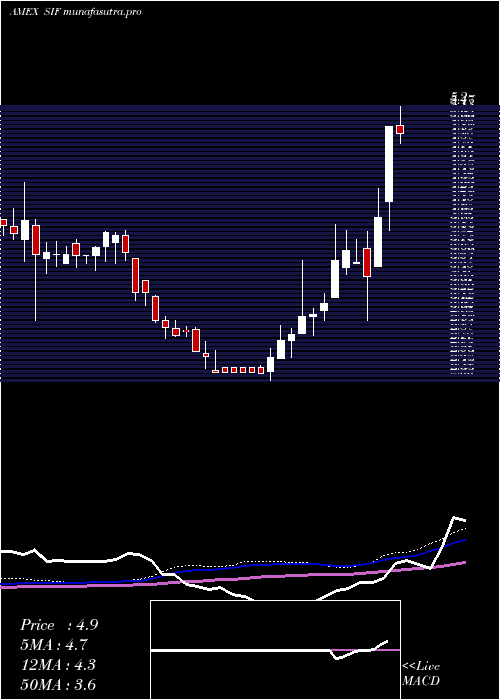
Weekly price and charts SifcoIndustries Strong weekly Stock price targets for SifcoIndustries SIF are 6.79 and 7.4 | Weekly Target 1 | 6.3 | | Weekly Target 2 | 6.66 | | Weekly Target 3 | 6.9066666666667 | | Weekly Target 4 | 7.27 | | Weekly Target 5 | 7.52 |
Weekly price and volumes for Sifco Industries
| Date |
Closing |
Open |
Range |
Volume |
Thu 23 October 2025 |
7.03 (5.56%) |
6.88 |
6.54 - 7.15 |
0.3041 times |
Fri 17 October 2025 |
6.66 (-3.48%) |
6.90 |
6.57 - 7.50 |
0.7685 times |
Fri 10 October 2025 |
6.90 (-3.5%) |
7.15 |
6.83 - 7.52 |
1.1058 times |
Fri 03 October 2025 |
7.15 (-0.42%) |
7.03 |
6.84 - 7.25 |
0.4236 times |
Fri 26 September 2025 |
7.18 (1.41%) |
6.79 |
6.79 - 7.60 |
0.9837 times |
Fri 19 September 2025 |
7.08 (-5.47%) |
7.50 |
6.70 - 7.60 |
1.3285 times |
Fri 12 September 2025 |
7.49 (5.79%) |
7.08 |
6.81 - 7.50 |
1.4547 times |
Fri 05 September 2025 |
7.08 (-0.14%) |
7.03 |
6.77 - 7.32 |
1.1042 times |
Fri 29 August 2025 |
7.09 (0%) |
6.76 |
6.76 - 7.10 |
0.5739 times |
Fri 29 August 2025 |
7.09 (-0.14%) |
7.15 |
6.51 - 7.75 |
1.9529 times |
Fri 22 August 2025 |
7.10 (5.97%) |
6.79 |
6.38 - 7.88 |
3.8728 times |
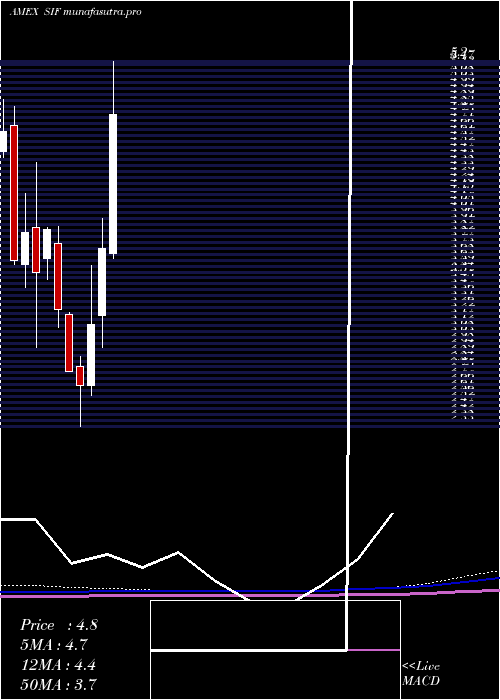
Monthly price and charts SifcoIndustries Strong monthly Stock price targets for SifcoIndustries SIF are 6.3 and 7.28 | Monthly Target 1 | 6.05 | | Monthly Target 2 | 6.54 | | Monthly Target 3 | 7.03 | | Monthly Target 4 | 7.52 | | Monthly Target 5 | 8.01 |
Monthly price and volumes Sifco Industries
| Date |
Closing |
Open |
Range |
Volume |
Thu 23 October 2025 |
7.03 (-0.14%) |
7.05 |
6.54 - 7.52 |
0.6957 times |
Tue 30 September 2025 |
7.04 (-0.71%) |
7.03 |
6.70 - 7.60 |
1.4285 times |
Fri 29 August 2025 |
7.09 (45.88%) |
4.72 |
4.45 - 7.88 |
3.1799 times |
Thu 31 July 2025 |
4.86 (30.29%) |
3.69 |
3.65 - 5.20 |
1.6657 times |
Mon 30 June 2025 |
3.73 (19.17%) |
3.20 |
2.95 - 3.96 |
0.9382 times |
Fri 30 May 2025 |
3.13 (18.11%) |
2.65 |
2.57 - 3.59 |
1.1251 times |
Wed 30 April 2025 |
2.65 (-3.99%) |
2.80 |
2.33 - 2.88 |
0.2596 times |
Mon 31 March 2025 |
2.76 (-15.08%) |
3.21 |
2.76 - 3.22 |
0.2101 times |
Fri 28 February 2025 |
3.25 (-16.24%) |
3.77 |
3.11 - 3.90 |
0.2175 times |
Fri 31 January 2025 |
3.88 (9.6%) |
3.65 |
3.48 - 3.89 |
0.2797 times |
Tue 31 December 2024 |
3.54 (-8.05%) |
3.89 |
2.95 - 4.40 |
0.6256 times |
DMA SMA EMA moving averages of Sifco Industries SIF
DMA (daily moving average) of Sifco Industries SIF
| DMA period | DMA value | | 5 day DMA | 6.8 | | 12 day DMA | 7.02 | | 20 day DMA | 7.06 | | 35 day DMA | 7.12 | | 50 day DMA | 7.07 | | 100 day DMA | 5.73 | | 150 day DMA | 4.74 | | 200 day DMA | 4.4 | EMA (exponential moving average) of Sifco Industries SIF
| EMA period | EMA current | EMA prev | EMA prev2 | | 5 day EMA | 6.92 | 6.87 | 6.82 | | 12 day EMA | 6.98 | 6.97 | 6.97 | | 20 day EMA | 7.01 | 7.01 | 7.01 | | 35 day EMA | 6.97 | 6.97 | 6.97 | | 50 day EMA | 6.92 | 6.92 | 6.92 |
SMA (simple moving average) of Sifco Industries SIF
| SMA period | SMA current | SMA prev | SMA prev2 | | 5 day SMA | 6.8 | 6.83 | 6.91 | | 12 day SMA | 7.02 | 7.06 | 7.07 | | 20 day SMA | 7.06 | 7.05 | 7.07 | | 35 day SMA | 7.12 | 7.13 | 7.12 | | 50 day SMA | 7.07 | 7.04 | 7.01 | | 100 day SMA | 5.73 | 5.69 | 5.65 | | 150 day SMA | 4.74 | 4.71 | 4.68 | | 200 day SMA | 4.4 | 4.38 | 4.37 |
|
|
