ShortS SH full analysis,charts,indicators,moving averages,SMA,DMA,EMA,ADX,MACD,RSIShort S SH WideScreen charts, DMA,SMA,EMA technical analysis, forecast prediction, by indicators ADX,MACD,RSI,CCI AMEX stock exchange
Daily price and charts and targets ShortS Strong Daily Stock price targets for ShortS SH are 36.58 and 36.93 | Daily Target 1 | 36.51 | | Daily Target 2 | 36.64 | | Daily Target 3 | 36.856666666667 | | Daily Target 4 | 36.99 | | Daily Target 5 | 37.21 |
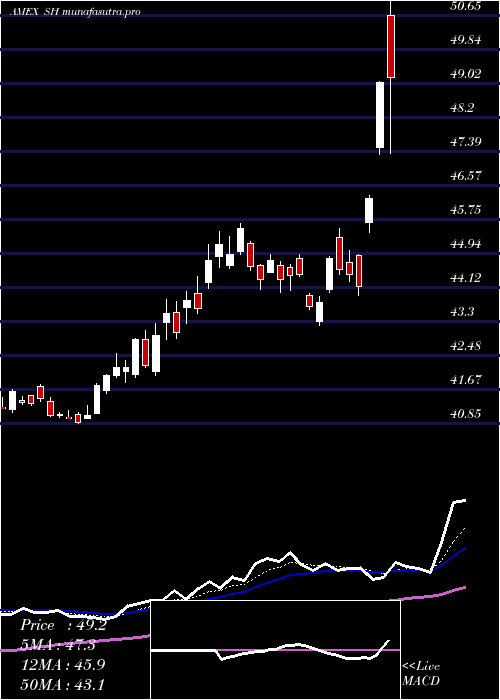
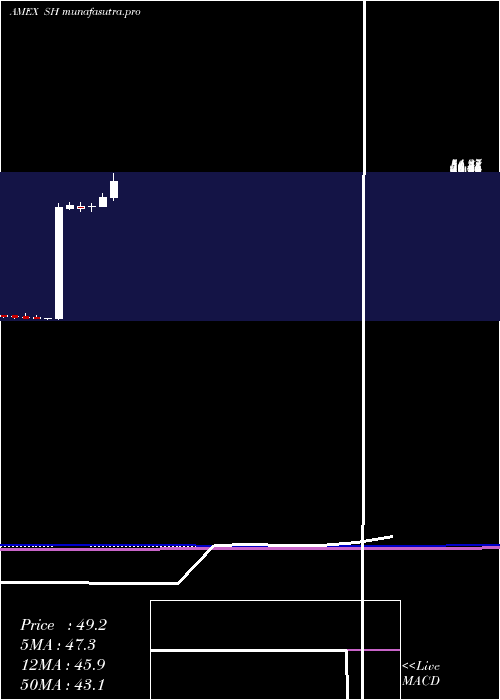
Daily price and volume Short S
| Date |
Closing |
Open |
Range |
Volume |
Thu 23 October 2025 |
36.78 (-0.54%) |
36.94 |
36.72 - 37.07 |
0.6993 times |
Wed 22 October 2025 |
36.98 (0.54%) |
36.78 |
36.74 - 37.23 |
1.0283 times |
Tue 21 October 2025 |
36.78 (0%) |
36.77 |
36.69 - 36.85 |
0.5281 times |
Mon 20 October 2025 |
36.78 (-1.02%) |
37.01 |
36.72 - 37.11 |
0.8774 times |
Fri 17 October 2025 |
37.16 (-0.51%) |
37.81 |
37.08 - 37.89 |
0.7628 times |
Thu 16 October 2025 |
37.35 (0.7%) |
36.99 |
36.89 - 37.54 |
0.9924 times |
Wed 15 October 2025 |
37.09 (-0.38%) |
36.98 |
36.80 - 37.43 |
0.8978 times |
Tue 14 October 2025 |
37.23 (0.13%) |
37.53 |
37.05 - 37.74 |
1.0321 times |
Mon 13 October 2025 |
37.18 (-1.51%) |
37.32 |
37.10 - 37.38 |
0.8812 times |
Fri 10 October 2025 |
37.75 (2.72%) |
36.72 |
36.62 - 37.78 |
2.3006 times |
Thu 09 October 2025 |
36.75 (0.33%) |
36.61 |
36.59 - 36.85 |
0.8242 times |
Weekly price and charts ShortS Strong weekly Stock price targets for ShortS SH are 36.47 and 37.01 | Weekly Target 1 | 36.36 | | Weekly Target 2 | 36.57 | | Weekly Target 3 | 36.9 | | Weekly Target 4 | 37.11 | | Weekly Target 5 | 37.44 |
Weekly price and volumes for Short S
| Date |
Closing |
Open |
Range |
Volume |
Thu 23 October 2025 |
36.78 (-1.02%) |
37.01 |
36.69 - 37.23 |
1.118 times |
Fri 17 October 2025 |
37.16 (-1.56%) |
37.32 |
36.80 - 37.89 |
1.6294 times |
Fri 10 October 2025 |
37.75 (2.5%) |
36.75 |
36.59 - 37.78 |
1.7144 times |
Fri 03 October 2025 |
36.83 (-0.97%) |
37.05 |
36.63 - 37.21 |
1.607 times |
Fri 26 September 2025 |
37.19 (-0.69%) |
37.53 |
37.00 - 37.58 |
0.8754 times |
Fri 19 September 2025 |
37.45 (-1.06%) |
37.74 |
37.39 - 38.06 |
0.907 times |
Fri 12 September 2025 |
37.85 (-1.41%) |
38.31 |
37.75 - 38.41 |
0.6944 times |
Fri 05 September 2025 |
38.39 (-0.23%) |
38.94 |
38.10 - 39.09 |
0.6822 times |
Fri 29 August 2025 |
38.48 (0%) |
38.33 |
38.31 - 38.59 |
0.1477 times |
Fri 29 August 2025 |
38.48 (0.21%) |
38.49 |
38.19 - 38.64 |
0.6245 times |
Fri 22 August 2025 |
38.40 (-0.16%) |
38.50 |
38.32 - 39.12 |
0.7618 times |

Monthly price and charts ShortS Strong monthly Stock price targets for ShortS SH are 36.04 and 37.34 | Monthly Target 1 | 35.79 | | Monthly Target 2 | 36.28 | | Monthly Target 3 | 37.086666666667 | | Monthly Target 4 | 37.58 | | Monthly Target 5 | 38.39 |
Monthly price and volumes Short S
| Date |
Closing |
Open |
Range |
Volume |
Thu 23 October 2025 |
36.78 (-0.49%) |
37.13 |
36.59 - 37.89 |
1.1003 times |
Tue 30 September 2025 |
36.96 (-3.95%) |
38.94 |
36.93 - 39.09 |
0.7271 times |
Fri 29 August 2025 |
38.48 (-1.46%) |
39.42 |
38.19 - 39.85 |
0.6537 times |
Thu 31 July 2025 |
39.05 (-1.59%) |
39.79 |
38.56 - 39.84 |
0.8414 times |
Mon 30 June 2025 |
39.68 (-5.37%) |
42.06 |
39.60 - 42.24 |
0.7689 times |
Fri 30 May 2025 |
41.93 (-5.54%) |
43.90 |
41.40 - 44.29 |
0.8813 times |
Wed 30 April 2025 |
44.39 (-0.38%) |
44.71 |
43.93 - 51.37 |
2.0884 times |
Mon 31 March 2025 |
44.56 (5.49%) |
42.10 |
42.01 - 45.67 |
1.3963 times |
Fri 28 February 2025 |
42.24 (1.81%) |
42.13 |
40.85 - 43.09 |
0.6884 times |
Fri 31 January 2025 |
41.49 (-2.1%) |
42.14 |
40.84 - 43.25 |
0.8542 times |
Tue 31 December 2024 |
42.38 (1.15%) |
41.53 |
41.17 - 43.39 |
0.4591 times |
DMA SMA EMA moving averages of Short S SH
DMA (daily moving average) of Short S SH
| DMA period | DMA value | | 5 day DMA | 36.9 | | 12 day DMA | 37.04 | | 20 day DMA | 36.98 | | 35 day DMA | 37.31 | | 50 day DMA | 37.68 | | 100 day DMA | 38.77 | | 150 day DMA | 40.69 | | 200 day DMA | 41.13 | EMA (exponential moving average) of Short S SH
| EMA period | EMA current | EMA prev | EMA prev2 | | 5 day EMA | 36.91 | 36.97 | 36.96 | | 12 day EMA | 36.99 | 37.03 | 37.04 | | 20 day EMA | 37.09 | 37.12 | 37.14 | | 35 day EMA | 37.37 | 37.41 | 37.44 | | 50 day EMA | 37.67 | 37.71 | 37.74 |
SMA (simple moving average) of Short S SH
| SMA period | SMA current | SMA prev | SMA prev2 | | 5 day SMA | 36.9 | 37.01 | 37.03 | | 12 day SMA | 37.04 | 37.04 | 37.02 | | 20 day SMA | 36.98 | 37.02 | 37.03 | | 35 day SMA | 37.31 | 37.36 | 37.4 | | 50 day SMA | 37.68 | 37.71 | 37.74 | | 100 day SMA | 38.77 | 38.82 | 38.87 | | 150 day SMA | 40.69 | 40.75 | 40.79 | | 200 day SMA | 41.13 | 41.15 | 41.18 |
|
|
