SpdrS SDY full analysis,charts,indicators,moving averages,SMA,DMA,EMA,ADX,MACD,RSISpdr S SDY WideScreen charts, DMA,SMA,EMA technical analysis, forecast prediction, by indicators ADX,MACD,RSI,CCI AMEX stock exchange
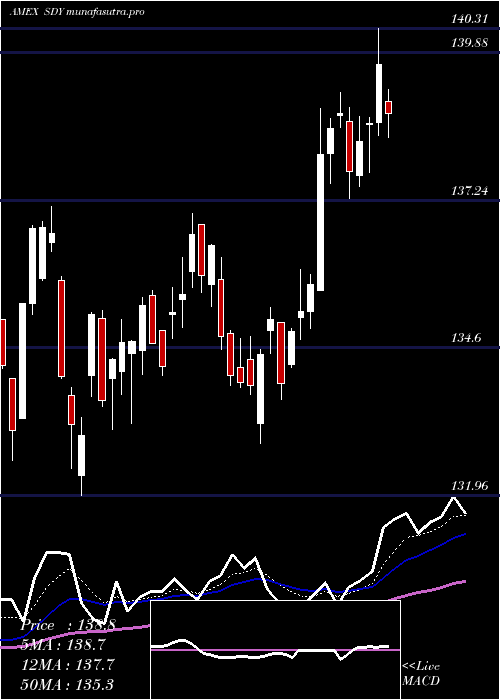
Daily price and charts and targets SpdrS Strong Daily Stock price targets for SpdrS SDY are 139.49 and 140.47 | Daily Target 1 | 138.79 | | Daily Target 2 | 139.21 | | Daily Target 3 | 139.77333333333 | | Daily Target 4 | 140.19 | | Daily Target 5 | 140.75 |
Daily price and volume Spdr S
| Date |
Closing |
Open |
Range |
Volume |
Fri 24 October 2025 |
139.62 (0.04%) |
139.36 |
139.36 - 140.34 |
0.8417 times |
Thu 23 October 2025 |
139.56 (-0.13%) |
139.91 |
138.94 - 140.09 |
0.8319 times |
Wed 22 October 2025 |
139.74 (-0.35%) |
140.00 |
139.66 - 140.75 |
1.0657 times |
Tue 21 October 2025 |
140.23 (0.04%) |
140.00 |
139.86 - 140.78 |
1.2032 times |
Mon 20 October 2025 |
140.17 (0.66%) |
139.60 |
139.60 - 140.28 |
0.7742 times |
Fri 17 October 2025 |
139.25 (0.68%) |
139.88 |
138.46 - 139.88 |
0.8416 times |
Thu 16 October 2025 |
138.31 (-0.9%) |
139.70 |
138.06 - 139.81 |
0.7511 times |
Wed 15 October 2025 |
139.57 (0%) |
139.86 |
138.54 - 140.60 |
1.3885 times |
Tue 14 October 2025 |
139.57 (1.12%) |
137.56 |
137.56 - 139.88 |
1.0833 times |
Mon 13 October 2025 |
138.03 (0.41%) |
137.90 |
137.60 - 138.58 |
1.2189 times |
Fri 10 October 2025 |
137.47 (-1.14%) |
139.55 |
137.47 - 139.78 |
1.638 times |
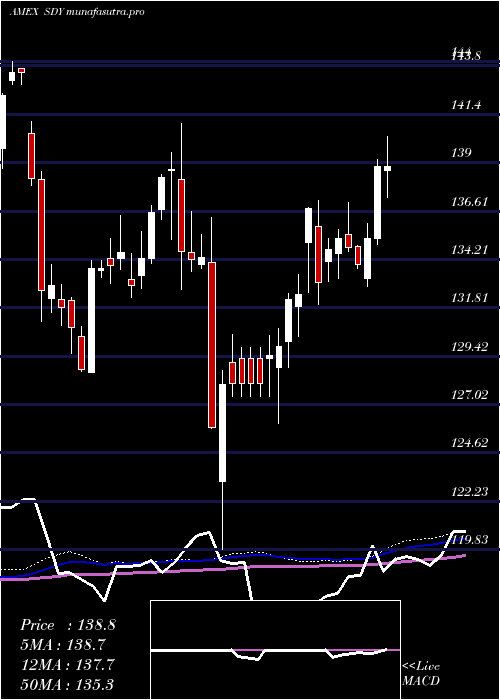
Weekly price and charts SpdrS Strong weekly Stock price targets for SpdrS SDY are 139.28 and 141.12 | Weekly Target 1 | 137.94 | | Weekly Target 2 | 138.78 | | Weekly Target 3 | 139.78 | | Weekly Target 4 | 140.62 | | Weekly Target 5 | 141.62 |
Weekly price and volumes for Spdr S
| Date |
Closing |
Open |
Range |
Volume |
Fri 24 October 2025 |
139.62 (0.27%) |
139.60 |
138.94 - 140.78 |
0.6678 times |
Fri 17 October 2025 |
139.25 (1.29%) |
137.90 |
137.56 - 140.60 |
0.748 times |
Fri 10 October 2025 |
137.47 (-2.25%) |
140.78 |
137.47 - 140.82 |
1.1268 times |
Fri 03 October 2025 |
140.64 (0.94%) |
139.68 |
138.78 - 141.33 |
1.0997 times |
Fri 26 September 2025 |
139.33 (-0.08%) |
138.42 |
137.80 - 139.33 |
1.756 times |
Fri 19 September 2025 |
139.44 (-0.87%) |
140.79 |
139.17 - 141.33 |
1.2532 times |
Fri 12 September 2025 |
140.66 (-0.17%) |
140.69 |
138.90 - 141.60 |
1.1511 times |
Fri 05 September 2025 |
140.90 (-0.31%) |
140.78 |
139.43 - 142.01 |
0.8568 times |
Fri 29 August 2025 |
141.34 (0%) |
141.13 |
140.95 - 141.80 |
0.1882 times |
Fri 29 August 2025 |
141.34 (-1.14%) |
142.58 |
140.62 - 142.74 |
1.1525 times |
Fri 22 August 2025 |
142.97 (1.93%) |
140.17 |
139.80 - 143.49 |
0.7477 times |
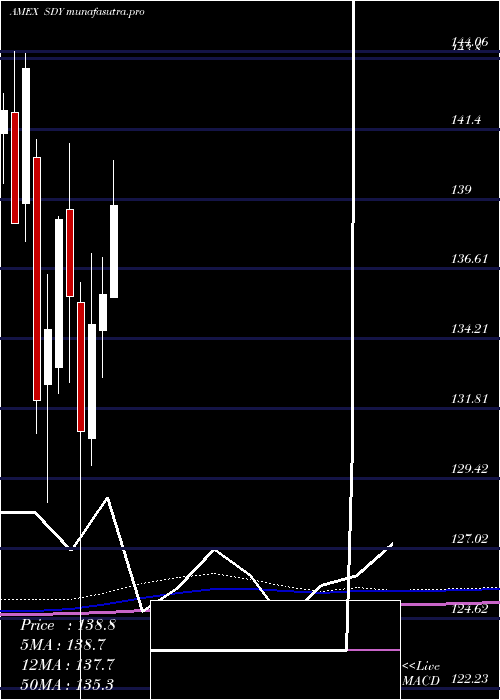
Monthly price and charts SpdrS Strong monthly Stock price targets for SpdrS SDY are 136.62 and 140.48 | Monthly Target 1 | 135.61 | | Monthly Target 2 | 137.62 | | Monthly Target 3 | 139.47333333333 | | Monthly Target 4 | 141.48 | | Monthly Target 5 | 143.33 |
Monthly price and volumes Spdr S
| Date |
Closing |
Open |
Range |
Volume |
Fri 24 October 2025 |
139.62 (-0.31%) |
140.01 |
137.47 - 141.33 |
0.6288 times |
Tue 30 September 2025 |
140.05 (-0.91%) |
140.78 |
137.80 - 142.01 |
1.1168 times |
Fri 29 August 2025 |
141.34 (3.2%) |
136.86 |
135.43 - 143.49 |
0.7865 times |
Thu 31 July 2025 |
136.96 (0.91%) |
135.63 |
135.63 - 140.52 |
0.9013 times |
Mon 30 June 2025 |
135.73 (0.76%) |
134.50 |
132.89 - 137.00 |
0.8799 times |
Fri 30 May 2025 |
134.70 (2.79%) |
130.79 |
129.86 - 137.13 |
0.8997 times |
Wed 30 April 2025 |
131.04 (-3.42%) |
135.46 |
119.83 - 136.16 |
1.268 times |
Mon 31 March 2025 |
135.68 (-1.89%) |
138.64 |
132.73 - 140.92 |
1.0345 times |
Fri 28 February 2025 |
138.29 (2.79%) |
133.22 |
132.34 - 138.40 |
1.0058 times |
Fri 31 January 2025 |
134.54 (1.85%) |
132.64 |
128.60 - 136.40 |
1.4787 times |
Tue 31 December 2024 |
132.10 (-7.93%) |
140.44 |
130.96 - 141.06 |
0.8705 times |
DMA SMA EMA moving averages of Spdr S SDY
DMA (daily moving average) of Spdr S SDY
| DMA period | DMA value | | 5 day DMA | 139.86 | | 12 day DMA | 139.22 | | 20 day DMA | 139.57 | | 35 day DMA | 139.56 | | 50 day DMA | 140.04 | | 100 day DMA | 138.74 | | 150 day DMA | 136.34 | | 200 day DMA | 135.96 | EMA (exponential moving average) of Spdr S SDY
| EMA period | EMA current | EMA prev | EMA prev2 | | 5 day EMA | 139.64 | 139.65 | 139.7 | | 12 day EMA | 139.54 | 139.52 | 139.51 | | 20 day EMA | 139.55 | 139.54 | 139.54 | | 35 day EMA | 139.78 | 139.79 | 139.8 | | 50 day EMA | 140.02 | 140.04 | 140.06 |
SMA (simple moving average) of Spdr S SDY
| SMA period | SMA current | SMA prev | SMA prev2 | | 5 day SMA | 139.86 | 139.79 | 139.54 | | 12 day SMA | 139.22 | 139.28 | 139.33 | | 20 day SMA | 139.57 | 139.56 | 139.48 | | 35 day SMA | 139.56 | 139.59 | 139.64 | | 50 day SMA | 140.04 | 140.05 | 140.07 | | 100 day SMA | 138.74 | 138.69 | 138.64 | | 150 day SMA | 136.34 | 136.31 | 136.28 | | 200 day SMA | 135.96 | 135.92 | 135.87 |
|
|
