GlobalX SDEM full analysis,charts,indicators,moving averages,SMA,DMA,EMA,ADX,MACD,RSIGlobal X SDEM WideScreen charts, DMA,SMA,EMA technical analysis, forecast prediction, by indicators ADX,MACD,RSI,CCI AMEX stock exchange
Daily price and charts and targets GlobalX Strong Daily Stock price targets for GlobalX SDEM are 28.74 and 29.29 | Daily Target 1 | 28.33 | | Daily Target 2 | 28.59 | | Daily Target 3 | 28.876666666667 | | Daily Target 4 | 29.14 | | Daily Target 5 | 29.43 |
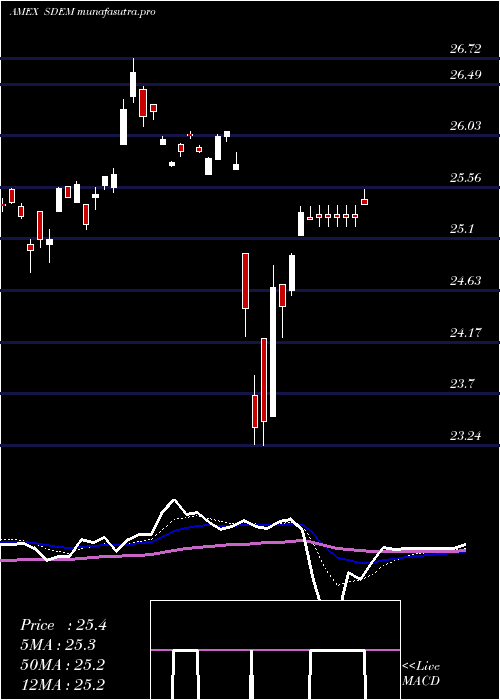
Daily price and volume Global X
| Date |
Closing |
Open |
Range |
Volume |
Thu 23 October 2025 |
28.86 (1.87%) |
28.61 |
28.61 - 29.16 |
3.3658 times |
Wed 22 October 2025 |
28.33 (0.78%) |
28.25 |
28.25 - 28.38 |
0.764 times |
Tue 21 October 2025 |
28.11 (-1.06%) |
28.24 |
28.11 - 28.26 |
0.5203 times |
Mon 20 October 2025 |
28.41 (1%) |
28.29 |
28.29 - 28.41 |
0.6765 times |
Fri 17 October 2025 |
28.13 (0.68%) |
27.90 |
27.90 - 28.14 |
0.314 times |
Thu 16 October 2025 |
27.94 (0.54%) |
27.96 |
27.92 - 28.06 |
0.7175 times |
Wed 15 October 2025 |
27.79 (0.25%) |
27.78 |
27.77 - 27.86 |
0.3902 times |
Tue 14 October 2025 |
27.72 (0.29%) |
27.48 |
27.48 - 27.82 |
1.3908 times |
Mon 13 October 2025 |
27.64 (1.77%) |
27.63 |
27.60 - 27.70 |
0.5203 times |
Fri 10 October 2025 |
27.16 (-2.06%) |
27.84 |
27.08 - 27.84 |
1.3407 times |
Thu 09 October 2025 |
27.73 (-0.04%) |
27.78 |
27.72 - 27.79 |
0.4202 times |
Weekly price and charts GlobalX Strong weekly Stock price targets for GlobalX SDEM are 28.49 and 29.54 | Weekly Target 1 | 27.66 | | Weekly Target 2 | 28.26 | | Weekly Target 3 | 28.71 | | Weekly Target 4 | 29.31 | | Weekly Target 5 | 29.76 |
Weekly price and volumes for Global X
| Date |
Closing |
Open |
Range |
Volume |
Thu 23 October 2025 |
28.86 (2.6%) |
28.29 |
28.11 - 29.16 |
1.5421 times |
Fri 17 October 2025 |
28.13 (3.57%) |
27.63 |
27.48 - 28.14 |
0.9649 times |
Fri 10 October 2025 |
27.16 (-2.44%) |
27.83 |
27.08 - 27.91 |
1.1443 times |
Fri 03 October 2025 |
27.84 (-0.78%) |
28.11 |
27.81 - 28.42 |
1.2824 times |
Fri 26 September 2025 |
28.06 (-1.47%) |
28.40 |
27.85 - 28.50 |
2.6215 times |
Fri 19 September 2025 |
28.48 (0.11%) |
28.53 |
28.36 - 28.71 |
0.5272 times |
Fri 12 September 2025 |
28.45 (0.85%) |
28.15 |
27.95 - 28.48 |
0.7966 times |
Fri 05 September 2025 |
28.21 (0.5%) |
27.81 |
27.81 - 28.21 |
0.2694 times |
Fri 29 August 2025 |
28.07 (0%) |
28.07 |
28.03 - 28.11 |
0.1275 times |
Fri 29 August 2025 |
28.07 (-1.68%) |
28.42 |
27.95 - 28.45 |
0.7242 times |
Fri 22 August 2025 |
28.55 (1.06%) |
28.25 |
27.96 - 28.57 |
0.42 times |

Monthly price and charts GlobalX Strong monthly Stock price targets for GlobalX SDEM are 27.97 and 30.05 | Monthly Target 1 | 26.29 | | Monthly Target 2 | 27.57 | | Monthly Target 3 | 28.366666666667 | | Monthly Target 4 | 29.65 | | Monthly Target 5 | 30.45 |
Monthly price and volumes Global X
| Date |
Closing |
Open |
Range |
Volume |
Thu 23 October 2025 |
28.86 (2.2%) |
28.18 |
27.08 - 29.16 |
0.8091 times |
Tue 30 September 2025 |
28.24 (0.61%) |
27.81 |
27.81 - 28.71 |
0.9541 times |
Fri 29 August 2025 |
28.07 (3.08%) |
27.48 |
27.25 - 28.58 |
0.6426 times |
Thu 31 July 2025 |
27.23 (-0.62%) |
27.38 |
27.13 - 27.95 |
0.5931 times |
Mon 30 June 2025 |
27.40 (4.5%) |
26.28 |
26.26 - 27.40 |
0.5142 times |
Fri 30 May 2025 |
26.22 (-0.23%) |
26.29 |
26.05 - 26.83 |
0.5293 times |
Wed 30 April 2025 |
26.28 (1.78%) |
25.81 |
23.24 - 26.29 |
0.8086 times |
Mon 31 March 2025 |
25.82 (3.28%) |
25.35 |
24.89 - 26.72 |
2.641 times |
Fri 28 February 2025 |
25.00 (-0.44%) |
24.66 |
24.66 - 25.97 |
1.1138 times |
Fri 31 January 2025 |
25.11 (4.32%) |
24.07 |
23.52 - 25.45 |
1.3942 times |
Tue 31 December 2024 |
24.07 (0.59%) |
24.27 |
24.01 - 25.60 |
0.9289 times |

DMA SMA EMA moving averages of Global X SDEM
DMA (daily moving average) of Global X SDEM
| DMA period | DMA value | | 5 day DMA | 28.37 | | 12 day DMA | 27.96 | | 20 day DMA | 27.97 | | 35 day DMA | 28.13 | | 50 day DMA | 28.14 | | 100 day DMA | 27.72 | | 150 day DMA | 27.1 | | 200 day DMA | 26.62 | EMA (exponential moving average) of Global X SDEM
| EMA period | EMA current | EMA prev | EMA prev2 | | 5 day EMA | 28.39 | 28.16 | 28.08 | | 12 day EMA | 28.16 | 28.03 | 27.97 | | 20 day EMA | 28.09 | 28.01 | 27.98 | | 35 day EMA | 28.1 | 28.05 | 28.03 | | 50 day EMA | 28.18 | 28.15 | 28.14 |
SMA (simple moving average) of Global X SDEM
| SMA period | SMA current | SMA prev | SMA prev2 | | 5 day SMA | 28.37 | 28.18 | 28.08 | | 12 day SMA | 27.96 | 27.87 | 27.82 | | 20 day SMA | 27.97 | 27.92 | 27.91 | | 35 day SMA | 28.13 | 28.1 | 28.09 | | 50 day SMA | 28.14 | 28.13 | 28.13 | | 100 day SMA | 27.72 | 27.69 | 27.67 | | 150 day SMA | 27.1 | 27.08 | 27.07 | | 200 day SMA | 26.62 | 26.6 | 26.58 |
|
|
