UscfSummerhaven SDCI full analysis,charts,indicators,moving averages,SMA,DMA,EMA,ADX,MACD,RSIUscf Summerhaven SDCI WideScreen charts, DMA,SMA,EMA technical analysis, forecast prediction, by indicators ADX,MACD,RSI,CCI AMEX stock exchange
Daily price and charts and targets UscfSummerhaven Strong Daily Stock price targets for UscfSummerhaven SDCI are 23.13 and 23.28 | Daily Target 1 | 23.1 | | Daily Target 2 | 23.16 | | Daily Target 3 | 23.253333333333 | | Daily Target 4 | 23.31 | | Daily Target 5 | 23.4 |
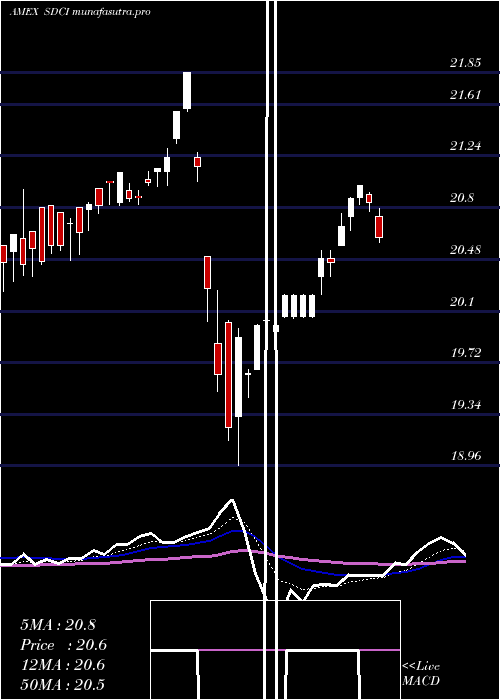
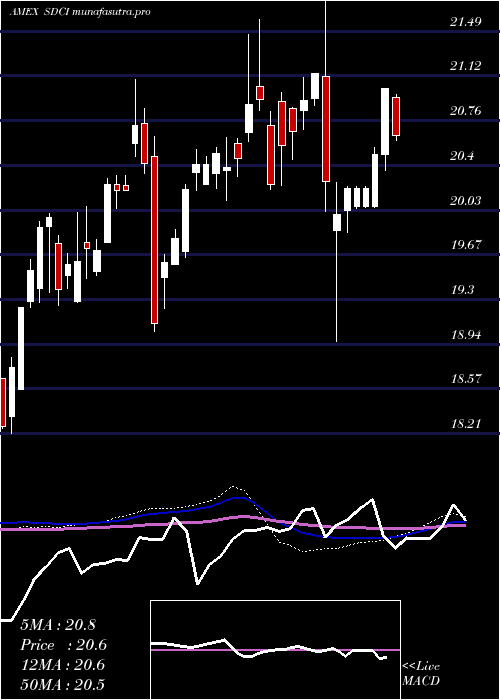
Daily price and volume Uscf Summerhaven
| Date |
Closing |
Open |
Range |
Volume |
Fri 24 October 2025 |
23.21 (-0.6%) |
23.30 |
23.20 - 23.35 |
0.9314 times |
Thu 23 October 2025 |
23.35 (1.26%) |
23.38 |
23.32 - 23.49 |
0.5852 times |
Wed 22 October 2025 |
23.06 (1.77%) |
22.89 |
22.86 - 23.08 |
0.8076 times |
Tue 21 October 2025 |
22.66 (-0.22%) |
22.62 |
22.46 - 22.69 |
0.6258 times |
Mon 20 October 2025 |
22.71 (0.66%) |
22.59 |
22.51 - 22.71 |
0.9657 times |
Fri 17 October 2025 |
22.56 (-0.66%) |
22.57 |
22.44 - 22.58 |
1.7183 times |
Thu 16 October 2025 |
22.71 (0%) |
22.76 |
22.66 - 22.93 |
0.3346 times |
Wed 15 October 2025 |
22.71 (0.31%) |
22.75 |
22.58 - 22.80 |
0.4903 times |
Tue 14 October 2025 |
22.64 (-0.66%) |
22.59 |
22.50 - 22.69 |
2.9001 times |
Mon 13 October 2025 |
22.79 (1.38%) |
22.77 |
22.71 - 22.85 |
0.6411 times |
Fri 10 October 2025 |
22.48 (-1.88%) |
22.80 |
22.41 - 22.83 |
1.0904 times |
Weekly price and charts UscfSummerhaven Strong weekly Stock price targets for UscfSummerhaven SDCI are 22.84 and 23.87 | Weekly Target 1 | 22.02 | | Weekly Target 2 | 22.62 | | Weekly Target 3 | 23.053333333333 | | Weekly Target 4 | 23.65 | | Weekly Target 5 | 24.08 |
Weekly price and volumes for Uscf Summerhaven
| Date |
Closing |
Open |
Range |
Volume |
Fri 24 October 2025 |
23.21 (2.88%) |
22.59 |
22.46 - 23.49 |
0.9046 times |
Fri 17 October 2025 |
22.56 (0.36%) |
22.77 |
22.44 - 22.93 |
1.4056 times |
Fri 10 October 2025 |
22.48 (-1.32%) |
22.87 |
22.41 - 23.16 |
0.8549 times |
Fri 03 October 2025 |
22.78 (-1.94%) |
23.18 |
22.70 - 23.18 |
1.0977 times |
Fri 26 September 2025 |
23.23 (2.38%) |
22.57 |
22.57 - 23.30 |
1.0512 times |
Fri 19 September 2025 |
22.69 (-0.79%) |
23.06 |
22.65 - 23.31 |
0.9208 times |
Fri 12 September 2025 |
22.87 (1.78%) |
22.61 |
22.50 - 22.98 |
1.1394 times |
Fri 05 September 2025 |
22.47 (-0.58%) |
22.72 |
22.40 - 23.00 |
1.0484 times |
Fri 29 August 2025 |
22.60 (0%) |
22.55 |
22.50 - 22.62 |
0.4749 times |
Fri 29 August 2025 |
22.60 (0.62%) |
22.53 |
22.30 - 22.73 |
1.1026 times |
Fri 22 August 2025 |
22.46 (2.37%) |
21.99 |
21.77 - 22.60 |
0.5113 times |
Monthly price and charts UscfSummerhaven Strong monthly Stock price targets for UscfSummerhaven SDCI are 22.81 and 23.89 | Monthly Target 1 | 21.96 | | Monthly Target 2 | 22.58 | | Monthly Target 3 | 23.036666666667 | | Monthly Target 4 | 23.66 | | Monthly Target 5 | 24.12 |
Monthly price and volumes Uscf Summerhaven
| Date |
Closing |
Open |
Range |
Volume |
Fri 24 October 2025 |
23.21 (0.91%) |
22.99 |
22.41 - 23.49 |
0.5972 times |
Tue 30 September 2025 |
23.00 (1.77%) |
22.72 |
22.40 - 23.31 |
0.6982 times |
Fri 29 August 2025 |
22.60 (2.82%) |
21.87 |
21.54 - 22.73 |
0.5884 times |
Thu 31 July 2025 |
21.98 (1.52%) |
21.65 |
21.46 - 22.51 |
1.0791 times |
Mon 30 June 2025 |
21.65 (5.46%) |
20.81 |
20.64 - 22.55 |
1.478 times |
Fri 30 May 2025 |
20.53 (1.43%) |
20.08 |
19.99 - 21.33 |
0.7443 times |
Wed 30 April 2025 |
20.24 (-4.62%) |
21.36 |
18.96 - 21.85 |
1.8864 times |
Mon 31 March 2025 |
21.22 (4.84%) |
20.91 |
20.23 - 21.29 |
0.6581 times |
Fri 28 February 2025 |
20.24 (-0.69%) |
20.57 |
20.20 - 21.58 |
0.7734 times |
Fri 31 January 2025 |
20.38 (4.94%) |
19.53 |
19.50 - 20.62 |
1.4968 times |
Tue 31 December 2024 |
19.42 (-3.81%) |
20.57 |
19.04 - 21.09 |
0.0735 times |

DMA SMA EMA moving averages of Uscf Summerhaven SDCI
DMA (daily moving average) of Uscf Summerhaven SDCI
| DMA period | DMA value | | 5 day DMA | 23 | | 12 day DMA | 22.82 | | 20 day DMA | 22.87 | | 35 day DMA | 22.88 | | 50 day DMA | 22.74 | | 100 day DMA | 22.3 | | 150 day DMA | 21.74 | | 200 day DMA | 21.45 | EMA (exponential moving average) of Uscf Summerhaven SDCI
| EMA period | EMA current | EMA prev | EMA prev2 | | 5 day EMA | 23.06 | 22.98 | 22.8 | | 12 day EMA | 22.92 | 22.87 | 22.78 | | 20 day EMA | 22.88 | 22.84 | 22.79 | | 35 day EMA | 22.79 | 22.76 | 22.72 | | 50 day EMA | 22.71 | 22.69 | 22.66 |
SMA (simple moving average) of Uscf Summerhaven SDCI
| SMA period | SMA current | SMA prev | SMA prev2 | | 5 day SMA | 23 | 22.87 | 22.74 | | 12 day SMA | 22.82 | 22.8 | 22.77 | | 20 day SMA | 22.87 | 22.87 | 22.86 | | 35 day SMA | 22.88 | 22.86 | 22.84 | | 50 day SMA | 22.74 | 22.72 | 22.69 | | 100 day SMA | 22.3 | 22.27 | 22.24 | | 150 day SMA | 21.74 | 21.73 | 21.71 | | 200 day SMA | 21.45 | 21.43 | 21.41 |
|
|
