SchwabUs SCHV full analysis,charts,indicators,moving averages,SMA,DMA,EMA,ADX,MACD,RSISchwab Us SCHV WideScreen charts, DMA,SMA,EMA technical analysis, forecast prediction, by indicators ADX,MACD,RSI,CCI AMEX stock exchange
Daily price and charts and targets SchwabUs Strong Daily Stock price targets for SchwabUs SCHV are 29 and 29.26 | Daily Target 1 | 28.93 | | Daily Target 2 | 29.06 | | Daily Target 3 | 29.186666666667 | | Daily Target 4 | 29.32 | | Daily Target 5 | 29.45 |
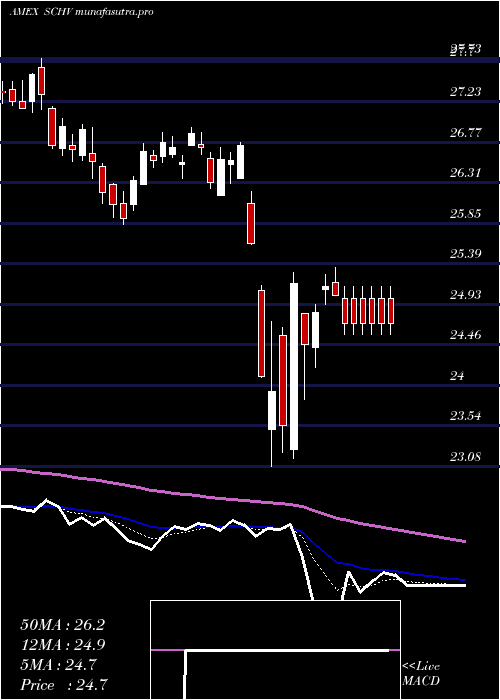
Daily price and volume Schwab Us
| Date |
Closing |
Open |
Range |
Volume |
Thu 23 October 2025 |
29.20 (0.38%) |
29.31 |
29.05 - 29.31 |
0.761 times |
Wed 22 October 2025 |
29.09 (-0.38%) |
29.22 |
28.96 - 29.22 |
1.4838 times |
Tue 21 October 2025 |
29.20 (0.07%) |
29.19 |
29.12 - 29.31 |
0.7673 times |
Mon 20 October 2025 |
29.18 (0.76%) |
29.15 |
29.07 - 29.21 |
0.8033 times |
Fri 17 October 2025 |
28.96 (0.45%) |
28.85 |
28.72 - 29.01 |
1.1599 times |
Thu 16 October 2025 |
28.83 (-0.96%) |
29.21 |
28.75 - 29.21 |
1.2315 times |
Wed 15 October 2025 |
29.11 (0.34%) |
29.15 |
28.90 - 29.33 |
1.2096 times |
Tue 14 October 2025 |
29.01 (0.83%) |
28.59 |
28.56 - 29.14 |
1.1056 times |
Mon 13 October 2025 |
28.77 (1.09%) |
28.62 |
28.62 - 28.84 |
0.5639 times |
Fri 10 October 2025 |
28.46 (-1.83%) |
29.07 |
28.45 - 29.13 |
0.9141 times |
Thu 09 October 2025 |
28.99 (-0.62%) |
29.22 |
28.93 - 29.24 |
0.7511 times |
Weekly price and charts SchwabUs Strong weekly Stock price targets for SchwabUs SCHV are 29.08 and 29.43 | Weekly Target 1 | 28.81 | | Weekly Target 2 | 29 | | Weekly Target 3 | 29.156666666667 | | Weekly Target 4 | 29.35 | | Weekly Target 5 | 29.51 |
Weekly price and volumes for Schwab Us
| Date |
Closing |
Open |
Range |
Volume |
Thu 23 October 2025 |
29.20 (0.83%) |
29.15 |
28.96 - 29.31 |
0.9115 times |
Fri 17 October 2025 |
28.96 (1.76%) |
28.62 |
28.56 - 29.33 |
1.2591 times |
Fri 10 October 2025 |
28.46 (-2.73%) |
29.35 |
28.45 - 29.36 |
0.8707 times |
Fri 03 October 2025 |
29.26 (0.83%) |
29.13 |
28.91 - 29.40 |
0.9394 times |
Fri 26 September 2025 |
29.02 (-0.1%) |
28.99 |
28.69 - 29.30 |
0.9411 times |
Fri 19 September 2025 |
29.05 (0.38%) |
29.01 |
28.79 - 29.18 |
1.0789 times |
Fri 12 September 2025 |
28.94 (0.98%) |
28.65 |
28.48 - 29.16 |
1.2863 times |
Fri 05 September 2025 |
28.66 (-0.31%) |
28.57 |
28.39 - 28.88 |
1.644 times |
Fri 29 August 2025 |
28.75 (0%) |
28.76 |
28.67 - 28.83 |
0.2189 times |
Fri 29 August 2025 |
28.75 (-0.14%) |
28.73 |
28.54 - 28.83 |
0.8501 times |
Fri 22 August 2025 |
28.79 (1.84%) |
28.23 |
28.22 - 28.88 |
1.0937 times |
Monthly price and charts SchwabUs Strong monthly Stock price targets for SchwabUs SCHV are 28.83 and 29.78 | Monthly Target 1 | 28.07 | | Monthly Target 2 | 28.63 | | Monthly Target 3 | 29.016666666667 | | Monthly Target 4 | 29.58 | | Monthly Target 5 | 29.97 |
Monthly price and volumes Schwab Us
| Date |
Closing |
Open |
Range |
Volume |
Thu 23 October 2025 |
29.20 (0.31%) |
29.05 |
28.45 - 29.40 |
1.1618 times |
Tue 30 September 2025 |
29.11 (1.25%) |
28.57 |
28.39 - 29.30 |
1.7539 times |
Fri 29 August 2025 |
28.75 (3.31%) |
27.69 |
27.39 - 28.88 |
1.3548 times |
Thu 31 July 2025 |
27.83 (0.58%) |
27.63 |
27.54 - 28.40 |
0.9317 times |
Mon 30 June 2025 |
27.67 (3.25%) |
26.76 |
26.53 - 27.70 |
0.7549 times |
Fri 30 May 2025 |
26.80 (3.92%) |
25.81 |
25.67 - 27.17 |
0.7065 times |
Wed 30 April 2025 |
25.79 (-2.97%) |
26.52 |
23.08 - 26.77 |
1.1372 times |
Mon 31 March 2025 |
26.58 (-3.49%) |
27.62 |
25.83 - 27.73 |
0.9228 times |
Fri 28 February 2025 |
27.54 (1.59%) |
26.75 |
26.66 - 27.64 |
0.5932 times |
Fri 31 January 2025 |
27.11 (3.99%) |
26.16 |
25.67 - 27.40 |
0.683 times |
Tue 31 December 2024 |
26.07 (-6.93%) |
27.61 |
25.70 - 27.65 |
0.5693 times |

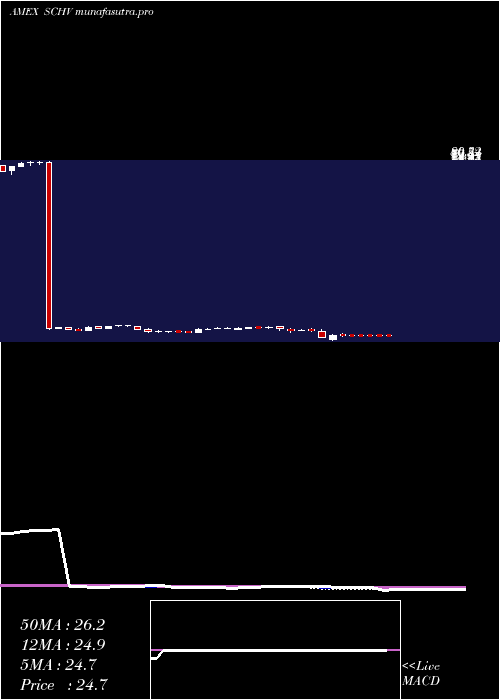
DMA SMA EMA moving averages of Schwab Us SCHV
DMA (daily moving average) of Schwab Us SCHV
| DMA period | DMA value | | 5 day DMA | 29.13 | | 12 day DMA | 29 | | 20 day DMA | 29.05 | | 35 day DMA | 28.99 | | 50 day DMA | 28.87 | | 100 day DMA | 28.3 | | 150 day DMA | 27.47 | | 200 day DMA | 27.33 | EMA (exponential moving average) of Schwab Us SCHV
| EMA period | EMA current | EMA prev | EMA prev2 | | 5 day EMA | 29.12 | 29.08 | 29.07 | | 12 day EMA | 29.06 | 29.04 | 29.03 | | 20 day EMA | 29.03 | 29.01 | 29 | | 35 day EMA | 28.95 | 28.93 | 28.92 | | 50 day EMA | 28.85 | 28.84 | 28.83 |
SMA (simple moving average) of Schwab Us SCHV
| SMA period | SMA current | SMA prev | SMA prev2 | | 5 day SMA | 29.13 | 29.05 | 29.06 | | 12 day SMA | 29 | 28.99 | 29 | | 20 day SMA | 29.05 | 29.03 | 29.02 | | 35 day SMA | 28.99 | 28.98 | 28.96 | | 50 day SMA | 28.87 | 28.85 | 28.84 | | 100 day SMA | 28.3 | 28.27 | 28.25 | | 150 day SMA | 27.47 | 27.45 | 27.43 | | 200 day SMA | 27.33 | 27.32 | 27.3 |
|
|
