SchwabUs SCHH full analysis,charts,indicators,moving averages,SMA,DMA,EMA,ADX,MACD,RSISchwab Us SCHH WideScreen charts, DMA,SMA,EMA technical analysis, forecast prediction, by indicators ADX,MACD,RSI,CCI AMEX stock exchange
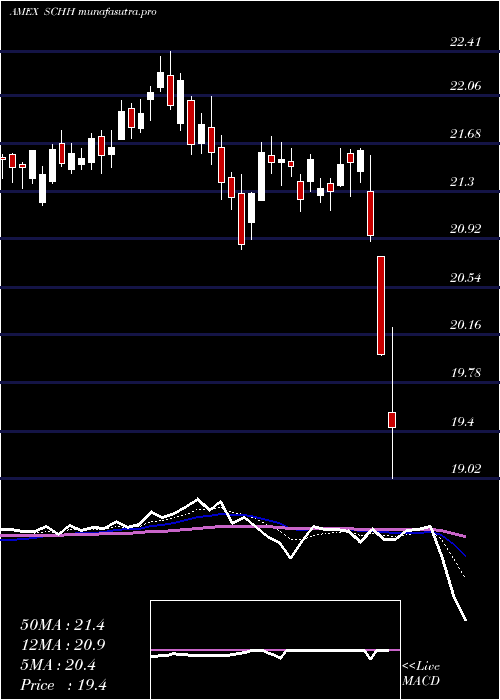
Daily price and charts and targets SchwabUs Strong Daily Stock price targets for SchwabUs SCHH are 21.16 and 21.34 | Daily Target 1 | 21.11 | | Daily Target 2 | 21.18 | | Daily Target 3 | 21.29 | | Daily Target 4 | 21.36 | | Daily Target 5 | 21.47 |
Daily price and volume Schwab Us
| Date |
Closing |
Open |
Range |
Volume |
Thu 04 December 2025 |
21.25 (-0.23%) |
21.25 |
21.22 - 21.40 |
1.3204 times |
Wed 03 December 2025 |
21.30 (0.09%) |
21.26 |
21.20 - 21.37 |
1.115 times |
Tue 02 December 2025 |
21.28 (-0.28%) |
21.41 |
21.20 - 21.42 |
0.9002 times |
Mon 01 December 2025 |
21.34 (-1.07%) |
21.40 |
21.33 - 21.47 |
0.7496 times |
Fri 28 November 2025 |
21.57 (0.33%) |
21.49 |
21.47 - 21.65 |
0.4434 times |
Wed 26 November 2025 |
21.50 (0.47%) |
21.39 |
21.33 - 21.62 |
0.6608 times |
Tue 25 November 2025 |
21.40 (0.8%) |
21.27 |
21.27 - 21.50 |
0.8692 times |
Mon 24 November 2025 |
21.23 (0.09%) |
21.10 |
21.07 - 21.26 |
0.8526 times |
Fri 21 November 2025 |
21.21 (1.39%) |
20.98 |
20.93 - 21.28 |
1.844 times |
Thu 20 November 2025 |
20.92 (-0.33%) |
21.12 |
20.91 - 21.22 |
1.2446 times |
Wed 19 November 2025 |
20.99 (-0.76%) |
21.15 |
20.91 - 21.17 |
1.2206 times |
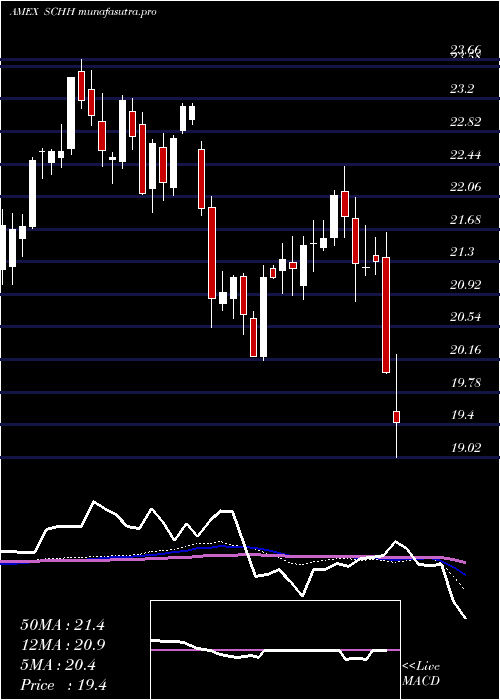
Weekly price and charts SchwabUs Strong weekly Stock price targets for SchwabUs SCHH are 21.09 and 21.36 | Weekly Target 1 | 21.04 | | Weekly Target 2 | 21.14 | | Weekly Target 3 | 21.306666666667 | | Weekly Target 4 | 21.41 | | Weekly Target 5 | 21.58 |
Weekly price and volumes for Schwab Us
| Date |
Closing |
Open |
Range |
Volume |
Thu 04 December 2025 |
21.25 (-1.48%) |
21.40 |
21.20 - 21.47 |
0.8875 times |
Fri 28 November 2025 |
21.57 (1.7%) |
21.10 |
21.07 - 21.65 |
0.6139 times |
Fri 21 November 2025 |
21.21 (0.05%) |
21.26 |
20.91 - 21.28 |
1.4675 times |
Fri 14 November 2025 |
21.20 (-0.84%) |
21.35 |
21.07 - 21.68 |
1.0238 times |
Fri 07 November 2025 |
21.38 (1.38%) |
21.13 |
20.98 - 21.38 |
0.887 times |
Fri 31 October 2025 |
21.09 (0%) |
20.89 |
20.85 - 21.15 |
0.2745 times |
Fri 31 October 2025 |
21.09 (-3.21%) |
21.80 |
20.85 - 21.86 |
1.4985 times |
Fri 24 October 2025 |
21.79 (0.97%) |
21.66 |
21.55 - 22.00 |
1.0594 times |
Fri 17 October 2025 |
21.58 (3.5%) |
20.85 |
20.81 - 21.61 |
1.2297 times |
Fri 10 October 2025 |
20.85 (-3.25%) |
21.55 |
20.82 - 21.57 |
1.0582 times |
Fri 03 October 2025 |
21.55 (0.7%) |
21.44 |
21.32 - 21.73 |
0.8754 times |
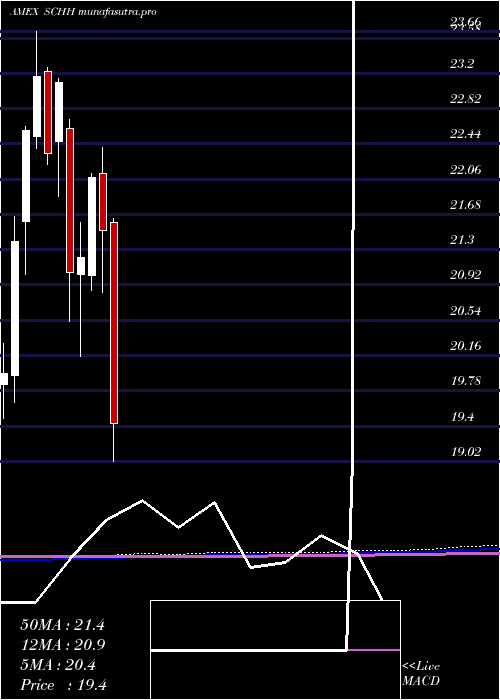
Monthly price and charts SchwabUs Strong monthly Stock price targets for SchwabUs SCHH are 21.09 and 21.36 | Monthly Target 1 | 21.04 | | Monthly Target 2 | 21.14 | | Monthly Target 3 | 21.306666666667 | | Monthly Target 4 | 21.41 | | Monthly Target 5 | 21.58 |
Monthly price and volumes Schwab Us
| Date |
Closing |
Open |
Range |
Volume |
Thu 04 December 2025 |
21.25 (-1.48%) |
21.40 |
21.20 - 21.47 |
0.2501 times |
Fri 28 November 2025 |
21.57 (2.28%) |
21.13 |
20.91 - 21.68 |
1.1251 times |
Fri 31 October 2025 |
21.09 (-2.23%) |
21.52 |
20.81 - 22.00 |
1.5965 times |
Tue 30 September 2025 |
21.57 (-0.19%) |
21.45 |
21.19 - 21.83 |
1.1556 times |
Fri 29 August 2025 |
21.61 (3.25%) |
21.07 |
20.65 - 21.71 |
1.1325 times |
Thu 31 July 2025 |
20.93 (-1.09%) |
21.12 |
20.89 - 21.81 |
1.0213 times |
Mon 30 June 2025 |
21.16 (-0.61%) |
21.16 |
20.74 - 21.74 |
0.8017 times |
Fri 30 May 2025 |
21.29 (1.24%) |
21.08 |
20.56 - 21.50 |
0.8143 times |
Wed 30 April 2025 |
21.03 (-2.23%) |
21.60 |
18.25 - 21.64 |
1.311 times |
Mon 31 March 2025 |
21.51 (-2.58%) |
22.12 |
20.84 - 22.41 |
0.7919 times |
Fri 28 February 2025 |
22.08 (4.05%) |
21.02 |
20.86 - 22.13 |
0.7189 times |
DMA SMA EMA moving averages of Schwab Us SCHH
DMA (daily moving average) of Schwab Us SCHH
| DMA period | DMA value | | 5 day DMA | 21.35 | | 12 day DMA | 21.26 | | 20 day DMA | 21.26 | | 35 day DMA | 21.33 | | 50 day DMA | 21.32 | | 100 day DMA | 21.34 | | 150 day DMA | 21.3 | | 200 day DMA | 21.24 | EMA (exponential moving average) of Schwab Us SCHH
| EMA period | EMA current | EMA prev | EMA prev2 | | 5 day EMA | 21.3 | 21.33 | 21.35 | | 12 day EMA | 21.3 | 21.31 | 21.31 | | 20 day EMA | 21.29 | 21.29 | 21.29 | | 35 day EMA | 21.32 | 21.32 | 21.32 | | 50 day EMA | 21.34 | 21.34 | 21.34 |
SMA (simple moving average) of Schwab Us SCHH
| SMA period | SMA current | SMA prev | SMA prev2 | | 5 day SMA | 21.35 | 21.4 | 21.42 | | 12 day SMA | 21.26 | 21.25 | 21.24 | | 20 day SMA | 21.26 | 21.25 | 21.24 | | 35 day SMA | 21.33 | 21.34 | 21.33 | | 50 day SMA | 21.32 | 21.32 | 21.33 | | 100 day SMA | 21.34 | 21.33 | 21.33 | | 150 day SMA | 21.3 | 21.29 | 21.29 | | 200 day SMA | 21.24 | 21.24 | 21.24 |
|
|
