SchwabUs SCHA full analysis,charts,indicators,moving averages,SMA,DMA,EMA,ADX,MACD,RSISchwab Us SCHA WideScreen charts, DMA,SMA,EMA technical analysis, forecast prediction, by indicators ADX,MACD,RSI,CCI AMEX stock exchange
Daily price and charts and targets SchwabUs Strong Daily Stock price targets for SchwabUs SCHA are 28.09 and 28.45 | Daily Target 1 | 27.8 | | Daily Target 2 | 28.02 | | Daily Target 3 | 28.16 | | Daily Target 4 | 28.38 | | Daily Target 5 | 28.52 |
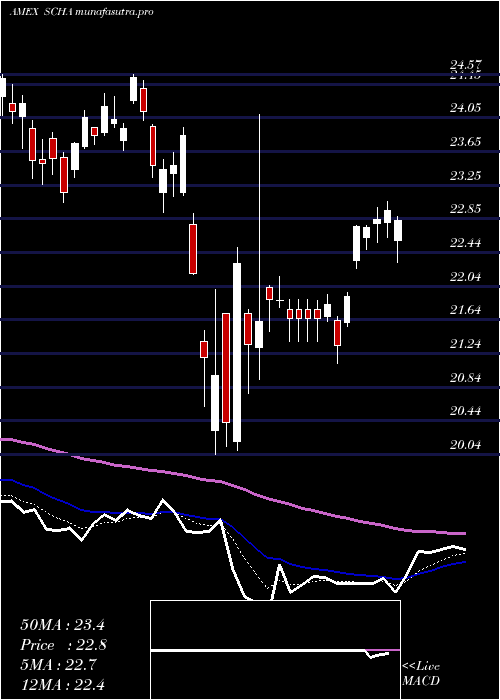
Daily price and volume Schwab Us
| Date |
Closing |
Open |
Range |
Volume |
Thu 23 October 2025 |
28.24 (1.15%) |
27.94 |
27.94 - 28.30 |
0.4724 times |
Wed 22 October 2025 |
27.92 (-1.27%) |
28.28 |
27.70 - 28.33 |
0.6776 times |
Tue 21 October 2025 |
28.28 (0.04%) |
28.22 |
28.08 - 28.42 |
0.639 times |
Mon 20 October 2025 |
28.27 (1.8%) |
27.74 |
27.74 - 28.31 |
0.5687 times |
Fri 17 October 2025 |
27.77 (-0.39%) |
27.19 |
27.15 - 27.93 |
1.1786 times |
Thu 16 October 2025 |
27.88 (-1.76%) |
28.35 |
27.74 - 28.58 |
1.8686 times |
Wed 15 October 2025 |
28.38 (0.85%) |
28.41 |
28.06 - 28.64 |
0.9369 times |
Tue 14 October 2025 |
28.14 (1.3%) |
27.41 |
27.37 - 28.33 |
1.2103 times |
Mon 13 October 2025 |
27.78 (2.25%) |
27.55 |
27.49 - 27.82 |
0.6877 times |
Fri 10 October 2025 |
27.17 (-3.1%) |
28.13 |
27.15 - 28.20 |
1.7602 times |
Thu 09 October 2025 |
28.04 (-0.85%) |
28.25 |
27.96 - 28.31 |
0.6801 times |
Weekly price and charts SchwabUs Strong weekly Stock price targets for SchwabUs SCHA are 27.97 and 28.69 | Weekly Target 1 | 27.4 | | Weekly Target 2 | 27.82 | | Weekly Target 3 | 28.12 | | Weekly Target 4 | 28.54 | | Weekly Target 5 | 28.84 |
Weekly price and volumes for Schwab Us
| Date |
Closing |
Open |
Range |
Volume |
Thu 23 October 2025 |
28.24 (1.69%) |
27.74 |
27.70 - 28.42 |
0.4629 times |
Fri 17 October 2025 |
27.77 (2.21%) |
27.55 |
27.15 - 28.64 |
1.1549 times |
Fri 10 October 2025 |
27.17 (-3.86%) |
28.30 |
27.15 - 28.55 |
0.8769 times |
Fri 03 October 2025 |
28.26 (1.44%) |
28.04 |
27.62 - 28.51 |
0.7567 times |
Fri 26 September 2025 |
27.86 (-0.85%) |
28.06 |
27.44 - 28.52 |
0.9911 times |
Fri 19 September 2025 |
28.10 (1.44%) |
27.80 |
27.52 - 28.39 |
1.231 times |
Fri 12 September 2025 |
27.70 (0.18%) |
27.72 |
27.35 - 27.98 |
1.5892 times |
Fri 05 September 2025 |
27.65 (1.24%) |
26.95 |
26.89 - 27.88 |
1.134 times |
Fri 29 August 2025 |
27.31 (0%) |
27.51 |
27.23 - 27.54 |
0.3779 times |
Fri 29 August 2025 |
27.31 (0.18%) |
27.19 |
27.02 - 27.54 |
1.4253 times |
Fri 22 August 2025 |
27.26 (2.87%) |
26.50 |
26.09 - 27.35 |
1.4187 times |

Monthly price and charts SchwabUs Strong monthly Stock price targets for SchwabUs SCHA are 27.7 and 29.19 | Monthly Target 1 | 26.52 | | Monthly Target 2 | 27.38 | | Monthly Target 3 | 28.01 | | Monthly Target 4 | 28.87 | | Monthly Target 5 | 29.5 |
Monthly price and volumes Schwab Us
| Date |
Closing |
Open |
Range |
Volume |
Thu 23 October 2025 |
28.24 (1.22%) |
27.78 |
27.15 - 28.64 |
0.7406 times |
Tue 30 September 2025 |
27.90 (2.16%) |
26.95 |
26.89 - 28.52 |
1.3473 times |
Fri 29 August 2025 |
27.31 (6.06%) |
25.43 |
24.95 - 27.54 |
1.3748 times |
Thu 31 July 2025 |
25.75 (1.78%) |
25.20 |
25.17 - 26.54 |
1.0487 times |
Mon 30 June 2025 |
25.30 (4.72%) |
24.17 |
23.84 - 25.48 |
0.9402 times |
Fri 30 May 2025 |
24.16 (5.83%) |
22.95 |
22.74 - 24.80 |
0.7188 times |
Wed 30 April 2025 |
22.83 (-2.56%) |
23.39 |
20.04 - 24.09 |
1.4311 times |
Mon 31 March 2025 |
23.43 (-7.28%) |
25.34 |
22.92 - 25.42 |
1.1774 times |
Fri 28 February 2025 |
25.27 (-5.39%) |
26.08 |
24.84 - 27.10 |
0.551 times |
Fri 31 January 2025 |
26.71 (3.29%) |
26.07 |
25.15 - 27.14 |
0.67 times |
Tue 31 December 2024 |
25.86 (-8%) |
28.08 |
25.52 - 28.18 |
0.4894 times |

DMA SMA EMA moving averages of Schwab Us SCHA
DMA (daily moving average) of Schwab Us SCHA
| DMA period | DMA value | | 5 day DMA | 28.1 | | 12 day DMA | 28.01 | | 20 day DMA | 28.02 | | 35 day DMA | 27.94 | | 50 day DMA | 27.65 | | 100 day DMA | 26.61 | | 150 day DMA | 25.45 | | 200 day DMA | 25.51 | EMA (exponential moving average) of Schwab Us SCHA
| EMA period | EMA current | EMA prev | EMA prev2 | | 5 day EMA | 28.11 | 28.05 | 28.12 | | 12 day EMA | 28.05 | 28.02 | 28.04 | | 20 day EMA | 28 | 27.97 | 27.97 | | 35 day EMA | 27.79 | 27.76 | 27.75 | | 50 day EMA | 27.58 | 27.55 | 27.54 |
SMA (simple moving average) of Schwab Us SCHA
| SMA period | SMA current | SMA prev | SMA prev2 | | 5 day SMA | 28.1 | 28.02 | 28.12 | | 12 day SMA | 28.01 | 27.99 | 28.03 | | 20 day SMA | 28.02 | 27.99 | 27.98 | | 35 day SMA | 27.94 | 27.91 | 27.89 | | 50 day SMA | 27.65 | 27.62 | 27.6 | | 100 day SMA | 26.61 | 26.57 | 26.54 | | 150 day SMA | 25.45 | 25.42 | 25.39 | | 200 day SMA | 25.51 | 25.5 | 25.49 |
|
|
