AdvisorsharesCornerstone SCAP full analysis,charts,indicators,moving averages,SMA,DMA,EMA,ADX,MACD,RSIAdvisorshares Cornerstone SCAP WideScreen charts, DMA,SMA,EMA technical analysis, forecast prediction, by indicators ADX,MACD,RSI,CCI AMEX stock exchange
Daily price and charts and targets AdvisorsharesCornerstone Strong Daily Stock price targets for AdvisorsharesCornerstone SCAP are 35.02 and 35.18 | Daily Target 1 | 34.99 | | Daily Target 2 | 35.05 | | Daily Target 3 | 35.146666666667 | | Daily Target 4 | 35.21 | | Daily Target 5 | 35.31 |
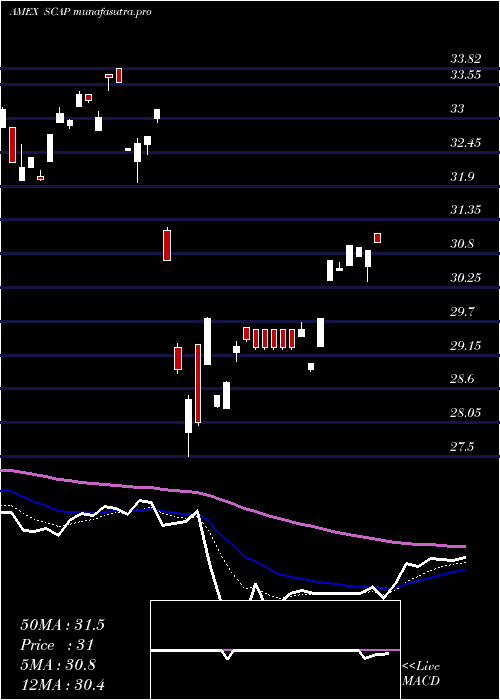
Daily price and volume Advisorshares Cornerstone
| Date |
Closing |
Open |
Range |
Volume |
Fri 24 October 2025 |
35.12 (1.27%) |
35.24 |
35.08 - 35.24 |
0.4114 times |
Thu 23 October 2025 |
34.68 (0.49%) |
34.74 |
34.61 - 34.74 |
0.3669 times |
Wed 22 October 2025 |
34.51 (-0.35%) |
34.68 |
34.32 - 34.75 |
1.5368 times |
Tue 21 October 2025 |
34.63 (0.44%) |
35.02 |
34.63 - 35.02 |
0.2359 times |
Mon 20 October 2025 |
34.48 (1.32%) |
34.69 |
34.40 - 34.69 |
0.3999 times |
Fri 17 October 2025 |
34.03 (0.15%) |
33.96 |
33.93 - 34.04 |
0.266 times |
Thu 16 October 2025 |
33.98 (-2.02%) |
34.37 |
33.98 - 34.46 |
1.7776 times |
Wed 15 October 2025 |
34.68 (0.43%) |
34.79 |
34.68 - 34.80 |
0.4979 times |
Tue 14 October 2025 |
34.53 (1.17%) |
34.25 |
34.25 - 34.63 |
2.6207 times |
Mon 13 October 2025 |
34.13 (1.79%) |
33.84 |
33.80 - 34.17 |
1.8869 times |
Fri 10 October 2025 |
33.53 (-3.06%) |
34.63 |
33.53 - 34.63 |
0.5241 times |
Weekly price and charts AdvisorsharesCornerstone Strong weekly Stock price targets for AdvisorsharesCornerstone SCAP are 34.72 and 35.64 | Weekly Target 1 | 33.97 | | Weekly Target 2 | 34.55 | | Weekly Target 3 | 34.893333333333 | | Weekly Target 4 | 35.47 | | Weekly Target 5 | 35.81 |
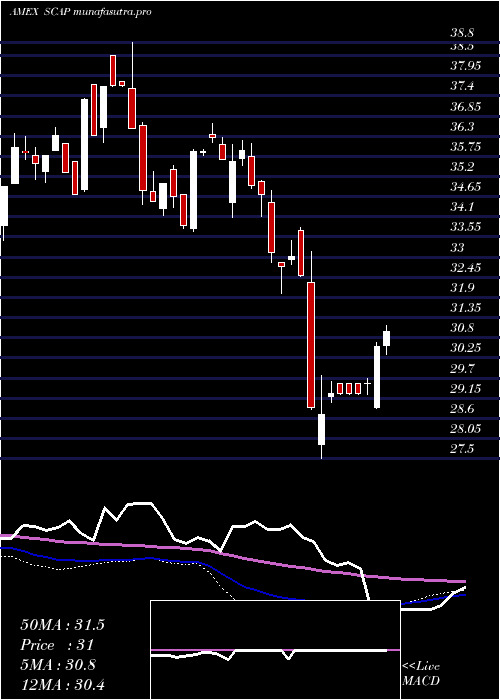
Weekly price and volumes for Advisorshares Cornerstone
| Date |
Closing |
Open |
Range |
Volume |
Fri 24 October 2025 |
35.12 (3.2%) |
34.69 |
34.32 - 35.24 |
0.6372 times |
Fri 17 October 2025 |
34.03 (1.49%) |
33.84 |
33.80 - 34.80 |
1.5222 times |
Fri 10 October 2025 |
33.53 (-5.66%) |
35.58 |
33.53 - 35.63 |
0.5772 times |
Fri 03 October 2025 |
35.54 (-0.31%) |
35.29 |
35.03 - 35.73 |
0.5857 times |
Fri 26 September 2025 |
35.65 (-1.36%) |
35.92 |
35.34 - 36.29 |
0.6451 times |
Fri 19 September 2025 |
36.14 (0.89%) |
35.87 |
35.59 - 36.60 |
1.8222 times |
Fri 12 September 2025 |
35.82 (0.7%) |
35.53 |
35.21 - 36.06 |
2.1335 times |
Fri 05 September 2025 |
35.57 (0.57%) |
35.07 |
34.93 - 35.94 |
0.1585 times |
Fri 29 August 2025 |
35.37 (0%) |
35.38 |
35.35 - 35.38 |
0.0679 times |
Fri 29 August 2025 |
35.37 (-0.23%) |
35.79 |
35.35 - 35.80 |
1.8505 times |
Fri 22 August 2025 |
35.45 (3.23%) |
34.44 |
34.40 - 35.52 |
0.9451 times |
Monthly price and charts AdvisorsharesCornerstone Strong monthly Stock price targets for AdvisorsharesCornerstone SCAP are 33.23 and 35.43 | Monthly Target 1 | 32.59 | | Monthly Target 2 | 33.86 | | Monthly Target 3 | 34.793333333333 | | Monthly Target 4 | 36.06 | | Monthly Target 5 | 36.99 |
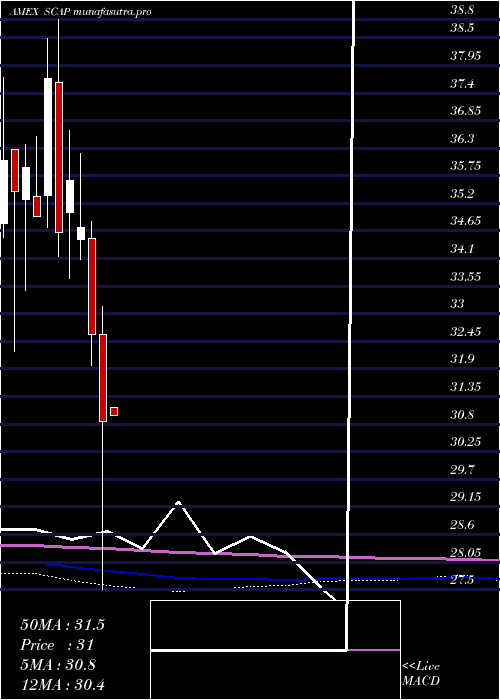
Monthly price and volumes Advisorshares Cornerstone
| Date |
Closing |
Open |
Range |
Volume |
Fri 24 October 2025 |
35.12 (-0.57%) |
35.30 |
33.53 - 35.73 |
0.9647 times |
Tue 30 September 2025 |
35.32 (-0.14%) |
35.07 |
34.93 - 36.60 |
1.5957 times |
Fri 29 August 2025 |
35.37 (4.52%) |
33.13 |
33.13 - 35.80 |
1.2676 times |
Thu 31 July 2025 |
33.84 (0.98%) |
34.22 |
33.84 - 35.22 |
1.0424 times |
Mon 30 June 2025 |
33.51 (4.39%) |
31.80 |
31.70 - 33.82 |
0.649 times |
Fri 30 May 2025 |
32.10 (4.02%) |
31.13 |
30.98 - 33.12 |
0.7225 times |
Wed 30 April 2025 |
30.86 (-5.31%) |
32.58 |
27.50 - 33.15 |
0.883 times |
Mon 31 March 2025 |
32.59 (-6.11%) |
34.49 |
31.96 - 34.83 |
0.829 times |
Fri 28 February 2025 |
34.71 (-2.66%) |
34.48 |
34.08 - 36.19 |
0.7028 times |
Fri 31 January 2025 |
35.66 (3%) |
35.02 |
33.70 - 36.66 |
1.3433 times |
Tue 31 December 2024 |
34.62 (-8.12%) |
37.61 |
34.14 - 38.86 |
1.0773 times |
DMA SMA EMA moving averages of Advisorshares Cornerstone SCAP
DMA (daily moving average) of Advisorshares Cornerstone SCAP
| DMA period | DMA value | | 5 day DMA | 34.68 | | 12 day DMA | 34.41 | | 20 day DMA | 34.78 | | 35 day DMA | 35.23 | | 50 day DMA | 35.22 | | 100 day DMA | 34.57 | | 150 day DMA | 33.42 | | 200 day DMA | 33.76 | EMA (exponential moving average) of Advisorshares Cornerstone SCAP
| EMA period | EMA current | EMA prev | EMA prev2 | | 5 day EMA | 34.73 | 34.53 | 34.45 | | 12 day EMA | 34.66 | 34.58 | 34.56 | | 20 day EMA | 34.78 | 34.74 | 34.75 | | 35 day EMA | 34.9 | 34.89 | 34.9 | | 50 day EMA | 35.1 | 35.1 | 35.12 |
SMA (simple moving average) of Advisorshares Cornerstone SCAP
| SMA period | SMA current | SMA prev | SMA prev2 | | 5 day SMA | 34.68 | 34.47 | 34.33 | | 12 day SMA | 34.41 | 34.4 | 34.44 | | 20 day SMA | 34.78 | 34.81 | 34.84 | | 35 day SMA | 35.23 | 35.24 | 35.27 | | 50 day SMA | 35.22 | 35.2 | 35.2 | | 100 day SMA | 34.57 | 34.54 | 34.51 | | 150 day SMA | 33.42 | 33.41 | 33.4 | | 200 day SMA | 33.76 | 33.76 | 33.76 |
|
|
