SP RZV full analysis,charts,indicators,moving averages,SMA,DMA,EMA,ADX,MACD,RSIS P RZV WideScreen charts, DMA,SMA,EMA technical analysis, forecast prediction, by indicators ADX,MACD,RSI,CCI AMEX stock exchange
Daily price and charts and targets SP Strong Daily Stock price targets for SP RZV are 119.56 and 120.55 | Daily Target 1 | 118.79 | | Daily Target 2 | 119.34 | | Daily Target 3 | 119.77666666667 | | Daily Target 4 | 120.33 | | Daily Target 5 | 120.77 |
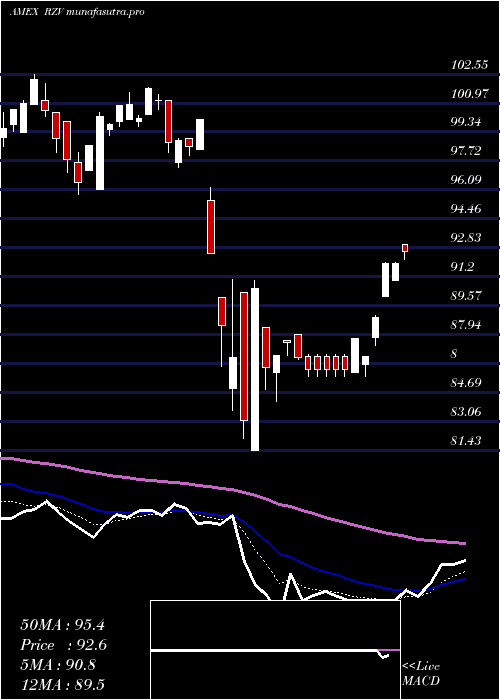
Daily price and volume S P
| Date |
Closing |
Open |
Range |
Volume |
Thu 23 October 2025 |
119.90 (1.45%) |
119.22 |
119.22 - 120.21 |
1.4043 times |
Wed 22 October 2025 |
118.19 (0.05%) |
118.17 |
117.59 - 118.20 |
0.2175 times |
Tue 21 October 2025 |
118.13 (0.29%) |
117.24 |
117.24 - 118.65 |
1.3245 times |
Mon 20 October 2025 |
117.79 (1.53%) |
116.83 |
116.83 - 117.88 |
0.5038 times |
Fri 17 October 2025 |
116.01 (-0.3%) |
115.88 |
115.82 - 116.02 |
0.2604 times |
Thu 16 October 2025 |
116.36 (-1.46%) |
117.45 |
116.05 - 117.55 |
0.4188 times |
Wed 15 October 2025 |
118.08 (-0.08%) |
119.34 |
118.01 - 120.35 |
0.6622 times |
Tue 14 October 2025 |
118.17 (2.26%) |
114.95 |
114.95 - 118.60 |
0.5727 times |
Mon 13 October 2025 |
115.56 (2.71%) |
114.58 |
114.58 - 115.60 |
0.8591 times |
Fri 10 October 2025 |
112.51 (-3.79%) |
117.00 |
112.20 - 117.00 |
3.7766 times |
Thu 09 October 2025 |
116.94 (-1.3%) |
117.38 |
116.62 - 117.41 |
0.2506 times |
Weekly price and charts SP Strong weekly Stock price targets for SP RZV are 118.37 and 121.75 | Weekly Target 1 | 115.6 | | Weekly Target 2 | 117.75 | | Weekly Target 3 | 118.98 | | Weekly Target 4 | 121.13 | | Weekly Target 5 | 122.36 |
Weekly price and volumes for S P
| Date |
Closing |
Open |
Range |
Volume |
Thu 23 October 2025 |
119.90 (3.35%) |
116.83 |
116.83 - 120.21 |
0.5311 times |
Fri 17 October 2025 |
116.01 (3.11%) |
114.58 |
114.58 - 120.35 |
0.4269 times |
Fri 10 October 2025 |
112.51 (-6.69%) |
120.64 |
112.20 - 120.64 |
0.8805 times |
Fri 03 October 2025 |
120.58 (1.87%) |
119.16 |
116.81 - 121.10 |
1.6182 times |
Fri 26 September 2025 |
118.37 (0.03%) |
117.71 |
116.23 - 119.08 |
1.1626 times |
Fri 19 September 2025 |
118.34 (0.14%) |
117.83 |
117.83 - 121.79 |
0.7576 times |
Fri 12 September 2025 |
118.18 (-1.13%) |
120.07 |
116.93 - 120.07 |
1.2673 times |
Fri 05 September 2025 |
119.53 (0.66%) |
116.77 |
116.70 - 120.90 |
2.025 times |
Fri 29 August 2025 |
118.75 (0%) |
118.61 |
118.20 - 118.75 |
0.0331 times |
Fri 29 August 2025 |
118.75 (1%) |
117.65 |
117.26 - 119.77 |
1.2976 times |
Fri 22 August 2025 |
117.58 (4.35%) |
112.86 |
112.42 - 117.62 |
0.3664 times |
Monthly price and charts SP Strong monthly Stock price targets for SP RZV are 116.05 and 124.95 | Monthly Target 1 | 108.83 | | Monthly Target 2 | 114.37 | | Monthly Target 3 | 117.73333333333 | | Monthly Target 4 | 123.27 | | Monthly Target 5 | 126.63 |
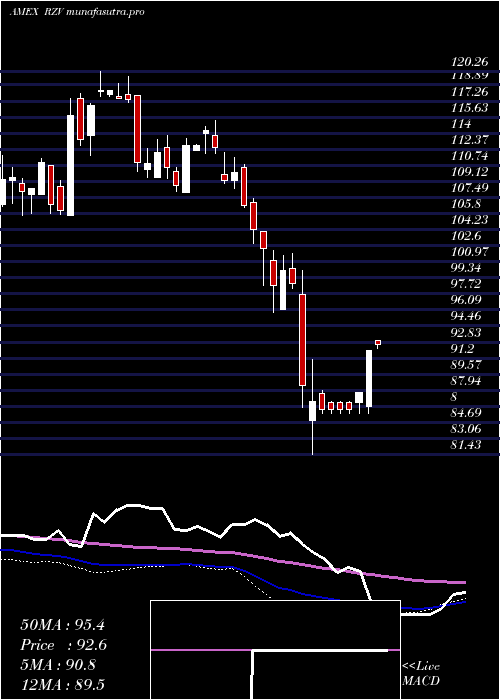
Monthly price and volumes S P
| Date |
Closing |
Open |
Range |
Volume |
Thu 23 October 2025 |
119.90 (1.58%) |
117.74 |
112.20 - 121.10 |
0.6746 times |
Tue 30 September 2025 |
118.04 (-0.6%) |
116.77 |
116.23 - 121.79 |
1.6902 times |
Fri 29 August 2025 |
118.75 (11.69%) |
105.07 |
103.54 - 119.77 |
0.7636 times |
Thu 31 July 2025 |
106.32 (1.48%) |
104.28 |
104.28 - 112.63 |
0.8206 times |
Mon 30 June 2025 |
104.77 (6.27%) |
98.09 |
97.56 - 105.46 |
0.4945 times |
Fri 30 May 2025 |
98.59 (6.61%) |
92.54 |
91.94 - 101.65 |
0.7966 times |
Wed 30 April 2025 |
92.48 (-6.44%) |
98.99 |
81.43 - 100.07 |
1.1915 times |
Mon 31 March 2025 |
98.85 (-5.17%) |
104.07 |
95.85 - 104.07 |
0.7205 times |
Fri 28 February 2025 |
104.24 (-7.34%) |
109.78 |
102.79 - 112.00 |
0.6831 times |
Fri 31 January 2025 |
112.50 (1.01%) |
112.78 |
108.02 - 115.25 |
2.1648 times |
Tue 31 December 2024 |
111.37 (-5.91%) |
117.74 |
109.47 - 119.80 |
0.7247 times |

DMA SMA EMA moving averages of S P RZV
DMA (daily moving average) of S P RZV
| DMA period | DMA value | | 5 day DMA | 118 | | 12 day DMA | 117.18 | | 20 day DMA | 117.75 | | 35 day DMA | 118.06 | | 50 day DMA | 117.61 | | 100 day DMA | 112.06 | | 150 day DMA | 105.96 | | 200 day DMA | 106.35 | EMA (exponential moving average) of S P RZV
| EMA period | EMA current | EMA prev | EMA prev2 | | 5 day EMA | 118.4 | 117.65 | 117.38 | | 12 day EMA | 117.83 | 117.45 | 117.31 | | 20 day EMA | 117.7 | 117.47 | 117.39 | | 35 day EMA | 117.34 | 117.19 | 117.13 | | 50 day EMA | 117.1 | 116.99 | 116.94 |
SMA (simple moving average) of S P RZV
| SMA period | SMA current | SMA prev | SMA prev2 | | 5 day SMA | 118 | 117.3 | 117.27 | | 12 day SMA | 117.18 | 116.97 | 117.07 | | 20 day SMA | 117.75 | 117.6 | 117.57 | | 35 day SMA | 118.06 | 118.03 | 118.01 | | 50 day SMA | 117.61 | 117.48 | 117.4 | | 100 day SMA | 112.06 | 111.85 | 111.66 | | 150 day SMA | 105.96 | 105.84 | 105.72 | | 200 day SMA | 106.35 | 106.3 | 106.27 |
|
|
