SP RZG full analysis,charts,indicators,moving averages,SMA,DMA,EMA,ADX,MACD,RSIS P RZG WideScreen charts, DMA,SMA,EMA technical analysis, forecast prediction, by indicators ADX,MACD,RSI,CCI AMEX stock exchange
Daily price and charts and targets SP Strong Daily Stock price targets for SP RZG are 54.73 and 55.23 | Daily Target 1 | 54.31 | | Daily Target 2 | 54.65 | | Daily Target 3 | 54.813333333333 | | Daily Target 4 | 55.15 | | Daily Target 5 | 55.31 |
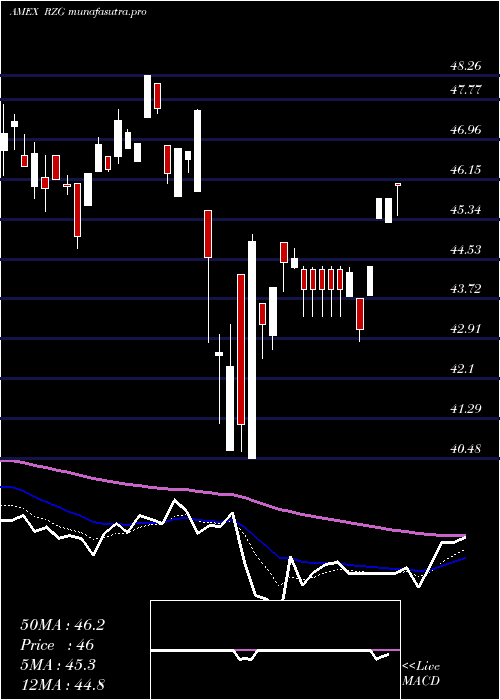
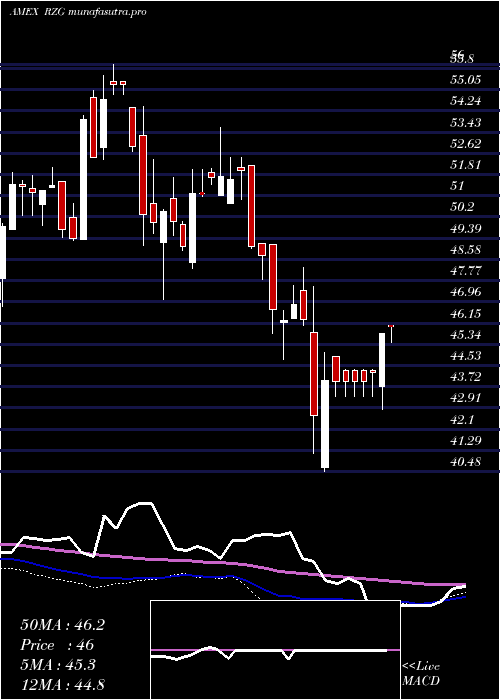
Daily price and volume S P
| Date |
Closing |
Open |
Range |
Volume |
Thu 23 October 2025 |
54.98 (0.9%) |
54.49 |
54.48 - 54.98 |
0.5984 times |
Wed 22 October 2025 |
54.49 (-1.2%) |
55.01 |
54.12 - 55.01 |
0.6872 times |
Tue 21 October 2025 |
55.15 (0.25%) |
54.82 |
54.82 - 55.15 |
2.6948 times |
Mon 20 October 2025 |
55.01 (1.59%) |
54.43 |
54.43 - 55.03 |
1.5697 times |
Fri 17 October 2025 |
54.15 (0.13%) |
53.87 |
53.87 - 54.15 |
0.2878 times |
Thu 16 October 2025 |
54.08 (-1.48%) |
54.80 |
54.00 - 54.83 |
0.3038 times |
Wed 15 October 2025 |
54.89 (0.68%) |
54.86 |
54.83 - 54.89 |
0.3062 times |
Tue 14 October 2025 |
54.52 (1.64%) |
52.71 |
52.71 - 54.70 |
2.4498 times |
Mon 13 October 2025 |
53.64 (1.51%) |
53.72 |
53.56 - 53.72 |
0.49 times |
Fri 10 October 2025 |
52.84 (-2.08%) |
54.00 |
52.84 - 54.00 |
0.6124 times |
Thu 09 October 2025 |
53.96 (-0.92%) |
53.99 |
53.83 - 54.09 |
2.5723 times |
Weekly price and charts SP Strong weekly Stock price targets for SP RZG are 54.55 and 55.58 | Weekly Target 1 | 53.72 | | Weekly Target 2 | 54.35 | | Weekly Target 3 | 54.75 | | Weekly Target 4 | 55.38 | | Weekly Target 5 | 55.78 |
Weekly price and volumes for S P
| Date |
Closing |
Open |
Range |
Volume |
Thu 23 October 2025 |
54.98 (1.53%) |
54.43 |
54.12 - 55.15 |
0.6811 times |
Fri 17 October 2025 |
54.15 (2.48%) |
53.72 |
52.71 - 54.89 |
0.471 times |
Fri 10 October 2025 |
52.84 (-3.38%) |
55.09 |
52.84 - 55.09 |
0.8521 times |
Fri 03 October 2025 |
54.69 (0.61%) |
54.82 |
53.97 - 55.20 |
3.9143 times |
Fri 26 September 2025 |
54.36 (-0.49%) |
54.83 |
53.56 - 54.91 |
0.7892 times |
Fri 19 September 2025 |
54.63 (0.76%) |
54.50 |
53.80 - 55.30 |
0.8794 times |
Fri 12 September 2025 |
54.22 (0.09%) |
53.94 |
53.54 - 54.82 |
0.6013 times |
Fri 05 September 2025 |
54.17 (0.26%) |
53.28 |
53.28 - 54.20 |
0.9245 times |
Fri 29 August 2025 |
54.03 (0%) |
54.03 |
54.03 - 54.03 |
0.0225 times |
Fri 29 August 2025 |
54.03 (-0.37%) |
54.18 |
53.63 - 54.43 |
0.8644 times |
Fri 22 August 2025 |
54.23 (3.28%) |
52.34 |
51.97 - 54.31 |
0.5938 times |
Monthly price and charts SP Strong monthly Stock price targets for SP RZG are 53.85 and 56.34 | Monthly Target 1 | 51.81 | | Monthly Target 2 | 53.39 | | Monthly Target 3 | 54.296666666667 | | Monthly Target 4 | 55.88 | | Monthly Target 5 | 56.79 |
Monthly price and volumes S P
| Date |
Closing |
Open |
Range |
Volume |
Thu 23 October 2025 |
54.98 (0.94%) |
54.12 |
52.71 - 55.20 |
0.649 times |
Tue 30 September 2025 |
54.47 (0.81%) |
53.28 |
53.28 - 55.30 |
0.4095 times |
Fri 29 August 2025 |
54.03 (5.78%) |
50.66 |
48.69 - 54.43 |
0.4959 times |
Thu 31 July 2025 |
51.08 (1.03%) |
50.60 |
50.36 - 52.50 |
0.6348 times |
Mon 30 June 2025 |
50.56 (3.78%) |
48.75 |
48.05 - 50.85 |
0.3562 times |
Fri 30 May 2025 |
48.72 (5.59%) |
46.32 |
46.32 - 49.65 |
1.967 times |
Wed 30 April 2025 |
46.14 (-1.33%) |
46.55 |
40.48 - 47.56 |
2.2787 times |
Mon 31 March 2025 |
46.76 (-4.04%) |
49.16 |
44.74 - 49.16 |
1.2423 times |
Fri 28 February 2025 |
48.73 (-5.84%) |
50.70 |
47.82 - 52.48 |
1.2398 times |
Fri 31 January 2025 |
51.75 (4.48%) |
48.71 |
47.04 - 53.60 |
0.7268 times |
Tue 31 December 2024 |
49.53 (-10.35%) |
54.38 |
49.09 - 54.41 |
1.2349 times |

DMA SMA EMA moving averages of S P RZG
DMA (daily moving average) of S P RZG
| DMA period | DMA value | | 5 day DMA | 54.76 | | 12 day DMA | 54.35 | | 20 day DMA | 54.37 | | 35 day DMA | 54.33 | | 50 day DMA | 54.09 | | 100 day DMA | 52.46 | | 150 day DMA | 50.42 | | 200 day DMA | 50.24 | EMA (exponential moving average) of S P RZG
| EMA period | EMA current | EMA prev | EMA prev2 | | 5 day EMA | 54.75 | 54.63 | 54.7 | | 12 day EMA | 54.53 | 54.45 | 54.44 | | 20 day EMA | 54.41 | 54.35 | 54.34 | | 35 day EMA | 54.19 | 54.14 | 54.12 | | 50 day EMA | 54.01 | 53.97 | 53.95 |
SMA (simple moving average) of S P RZG
| SMA period | SMA current | SMA prev | SMA prev2 | | 5 day SMA | 54.76 | 54.58 | 54.66 | | 12 day SMA | 54.35 | 54.26 | 54.26 | | 20 day SMA | 54.37 | 54.31 | 54.29 | | 35 day SMA | 54.33 | 54.31 | 54.28 | | 50 day SMA | 54.09 | 54.04 | 54.03 | | 100 day SMA | 52.46 | 52.39 | 52.34 | | 150 day SMA | 50.42 | 50.37 | 50.32 | | 200 day SMA | 50.24 | 50.22 | 50.2 |
|
|
