ShortRussell RWM full analysis,charts,indicators,moving averages,SMA,DMA,EMA,ADX,MACD,RSIShort Russell RWM WideScreen charts, DMA,SMA,EMA technical analysis, forecast prediction, by indicators ADX,MACD,RSI,CCI AMEX stock exchange
Daily price and charts and targets ShortRussell Strong Daily Stock price targets for ShortRussell RWM are 16.1 and 16.38 | Daily Target 1 | 16.03 | | Daily Target 2 | 16.17 | | Daily Target 3 | 16.313333333333 | | Daily Target 4 | 16.45 | | Daily Target 5 | 16.59 |
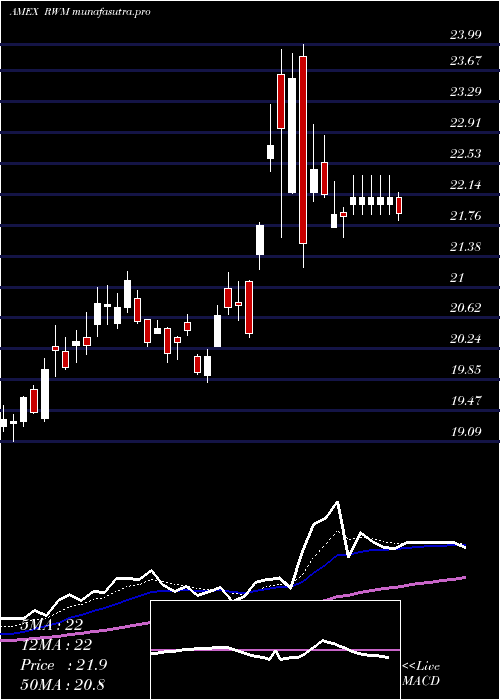
Daily price and volume Short Russell
| Date |
Closing |
Open |
Range |
Volume |
Fri 24 October 2025 |
16.30 (-1.21%) |
16.46 |
16.18 - 16.46 |
0.7923 times |
Thu 23 October 2025 |
16.50 (-1.2%) |
16.60 |
16.45 - 16.69 |
0.8933 times |
Wed 22 October 2025 |
16.70 (1.52%) |
16.45 |
16.42 - 16.87 |
1.4584 times |
Tue 21 October 2025 |
16.45 (0.43%) |
16.42 |
16.36 - 16.55 |
0.729 times |
Mon 20 October 2025 |
16.38 (-1.92%) |
16.56 |
16.36 - 16.60 |
0.6729 times |
Fri 17 October 2025 |
16.70 (0.72%) |
16.85 |
16.58 - 16.91 |
0.967 times |
Thu 16 October 2025 |
16.58 (2.16%) |
16.18 |
16.16 - 16.65 |
1.2858 times |
Wed 15 October 2025 |
16.23 (-0.98%) |
16.23 |
16.08 - 16.44 |
1.1163 times |
Tue 14 October 2025 |
16.39 (-1.44%) |
16.85 |
16.28 - 16.90 |
1.1725 times |
Mon 13 October 2025 |
16.63 (-2.75%) |
16.80 |
16.61 - 16.84 |
0.9124 times |
Fri 10 October 2025 |
17.10 (3.07%) |
16.56 |
16.48 - 17.11 |
1.1227 times |
Weekly price and charts ShortRussell Strong weekly Stock price targets for ShortRussell RWM are 15.9 and 16.59 | Weekly Target 1 | 15.76 | | Weekly Target 2 | 16.03 | | Weekly Target 3 | 16.45 | | Weekly Target 4 | 16.72 | | Weekly Target 5 | 17.14 |
Weekly price and volumes for Short Russell
| Date |
Closing |
Open |
Range |
Volume |
Fri 24 October 2025 |
16.30 (-2.4%) |
16.56 |
16.18 - 16.87 |
1.155 times |
Fri 17 October 2025 |
16.70 (-2.34%) |
16.80 |
16.08 - 16.91 |
1.3858 times |
Fri 10 October 2025 |
17.10 (3.39%) |
16.49 |
16.36 - 17.11 |
1.1366 times |
Fri 03 October 2025 |
16.54 (-1.66%) |
16.72 |
16.38 - 16.96 |
0.9545 times |
Fri 26 September 2025 |
16.82 (0%) |
16.87 |
16.55 - 17.07 |
1.0119 times |
Fri 19 September 2025 |
16.82 (-2.15%) |
17.13 |
16.65 - 17.27 |
1.1654 times |
Fri 12 September 2025 |
17.19 (-0.12%) |
17.17 |
17.00 - 17.39 |
0.9611 times |
Fri 05 September 2025 |
17.21 (-0.92%) |
17.61 |
17.07 - 17.65 |
1.0869 times |
Fri 29 August 2025 |
17.37 (0%) |
17.26 |
17.25 - 17.44 |
0.2216 times |
Fri 29 August 2025 |
17.37 (-0.12%) |
17.45 |
17.23 - 17.57 |
0.9213 times |
Fri 22 August 2025 |
17.39 (-3.23%) |
17.98 |
17.34 - 18.26 |
1.2967 times |

Monthly price and charts ShortRussell Strong monthly Stock price targets for ShortRussell RWM are 15.68 and 16.71 | Monthly Target 1 | 15.47 | | Monthly Target 2 | 15.88 | | Monthly Target 3 | 16.496666666667 | | Monthly Target 4 | 16.91 | | Monthly Target 5 | 17.53 |
Monthly price and volumes Short Russell
| Date |
Closing |
Open |
Range |
Volume |
Fri 24 October 2025 |
16.30 (-2.92%) |
16.88 |
16.08 - 17.11 |
0.922 times |
Tue 30 September 2025 |
16.79 (-3.34%) |
17.61 |
16.55 - 17.65 |
0.9903 times |
Fri 29 August 2025 |
17.37 (-6.56%) |
18.87 |
17.23 - 19.19 |
1.1011 times |
Thu 31 July 2025 |
18.59 (-1.22%) |
18.93 |
17.98 - 18.96 |
1.085 times |
Mon 30 June 2025 |
18.82 (-5.9%) |
19.98 |
18.69 - 20.23 |
0.8553 times |
Fri 30 May 2025 |
20.00 (-4.76%) |
20.91 |
19.49 - 21.11 |
1.6084 times |
Wed 30 April 2025 |
21.00 (1.2%) |
20.81 |
20.37 - 23.99 |
0.9091 times |
Mon 31 March 2025 |
20.75 (6.68%) |
19.38 |
19.34 - 21.19 |
0.8552 times |
Fri 28 February 2025 |
19.45 (5.94%) |
18.77 |
18.03 - 19.78 |
0.7244 times |
Fri 31 January 2025 |
18.36 (-2.03%) |
18.58 |
18.04 - 19.37 |
0.9494 times |
Tue 31 December 2024 |
18.74 (7.39%) |
17.51 |
17.44 - 19.24 |
0.4845 times |

DMA SMA EMA moving averages of Short Russell RWM
DMA (daily moving average) of Short Russell RWM
| DMA period | DMA value | | 5 day DMA | 16.47 | | 12 day DMA | 16.55 | | 20 day DMA | 16.59 | | 35 day DMA | 16.76 | | 50 day DMA | 17 | | 100 day DMA | 17.84 | | 150 day DMA | 18.87 | | 200 day DMA | 18.94 | EMA (exponential moving average) of Short Russell RWM
| EMA period | EMA current | EMA prev | EMA prev2 | | 5 day EMA | 16.46 | 16.54 | 16.56 | | 12 day EMA | 16.53 | 16.57 | 16.58 | | 20 day EMA | 16.62 | 16.65 | 16.67 | | 35 day EMA | 16.82 | 16.85 | 16.87 | | 50 day EMA | 17.02 | 17.05 | 17.07 |
SMA (simple moving average) of Short Russell RWM
| SMA period | SMA current | SMA prev | SMA prev2 | | 5 day SMA | 16.47 | 16.55 | 16.56 | | 12 day SMA | 16.55 | 16.56 | 16.57 | | 20 day SMA | 16.59 | 16.61 | 16.64 | | 35 day SMA | 16.76 | 16.79 | 16.81 | | 50 day SMA | 17 | 17.03 | 17.06 | | 100 day SMA | 17.84 | 17.88 | 17.91 | | 150 day SMA | 18.87 | 18.9 | 18.92 | | 200 day SMA | 18.94 | 18.95 | 18.96 |
|
|
