InspireTactical RISN full analysis,charts,indicators,moving averages,SMA,DMA,EMA,ADX,MACD,RSIInspire Tactical RISN WideScreen charts, DMA,SMA,EMA technical analysis, forecast prediction, by indicators ADX,MACD,RSI,CCI AMEX stock exchange
Daily price and charts and targets InspireTactical Strong Daily Stock price targets for InspireTactical RISN are 29.45 and 29.6 | Daily Target 1 | 29.42 | | Daily Target 2 | 29.47 | | Daily Target 3 | 29.57 | | Daily Target 4 | 29.62 | | Daily Target 5 | 29.72 |
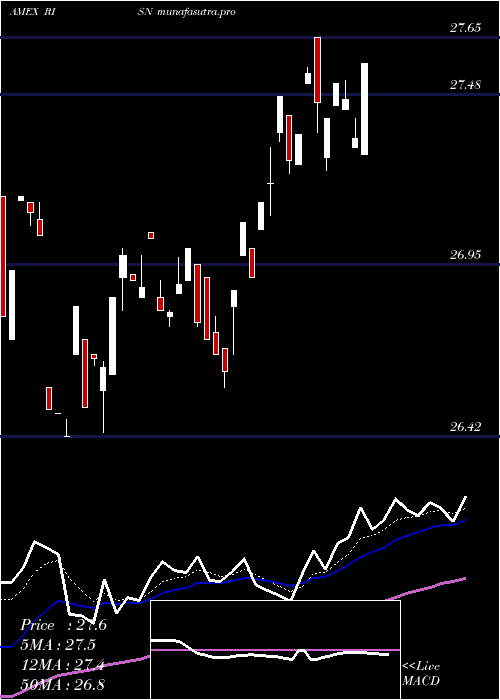
Daily price and volume Inspire Tactical
| Date |
Closing |
Open |
Range |
Volume |
Fri 24 October 2025 |
29.52 (-0.1%) |
29.62 |
29.52 - 29.67 |
0.6646 times |
Thu 23 October 2025 |
29.55 (1.03%) |
29.38 |
29.35 - 29.55 |
2.2242 times |
Wed 22 October 2025 |
29.25 (-0.31%) |
29.43 |
29.16 - 29.43 |
0.3131 times |
Tue 21 October 2025 |
29.34 (-0.51%) |
29.35 |
29.34 - 29.35 |
0.1479 times |
Mon 20 October 2025 |
29.49 (0.55%) |
29.47 |
29.47 - 29.49 |
0.1811 times |
Fri 17 October 2025 |
29.33 (-0.58%) |
29.27 |
29.27 - 29.37 |
0.5863 times |
Thu 16 October 2025 |
29.50 (-0.03%) |
29.71 |
29.43 - 29.71 |
2.2231 times |
Wed 15 October 2025 |
29.51 (0.2%) |
29.57 |
29.51 - 29.58 |
1.7744 times |
Tue 14 October 2025 |
29.45 (-0.03%) |
29.07 |
29.07 - 29.53 |
0.7393 times |
Mon 13 October 2025 |
29.46 (1.41%) |
29.38 |
29.36 - 29.46 |
1.1459 times |
Fri 10 October 2025 |
29.05 (-2.09%) |
29.34 |
29.05 - 29.35 |
2.8833 times |
Weekly price and charts InspireTactical Strong weekly Stock price targets for InspireTactical RISN are 29.34 and 29.85 | Weekly Target 1 | 28.94 | | Weekly Target 2 | 29.23 | | Weekly Target 3 | 29.45 | | Weekly Target 4 | 29.74 | | Weekly Target 5 | 29.96 |
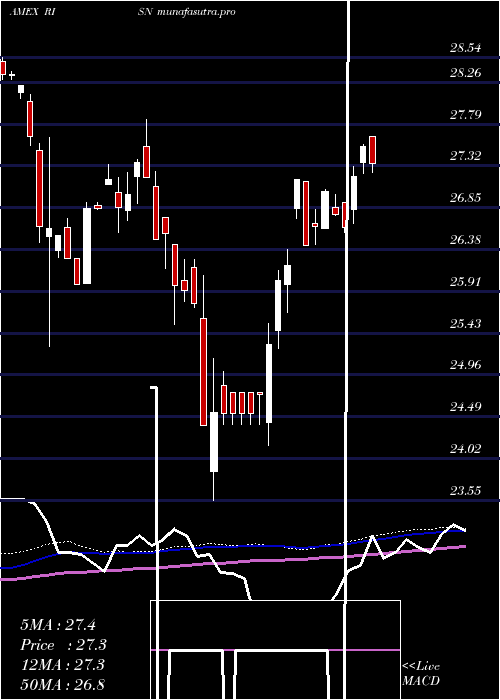
Weekly price and volumes for Inspire Tactical
| Date |
Closing |
Open |
Range |
Volume |
Fri 24 October 2025 |
29.52 (0.65%) |
29.47 |
29.16 - 29.67 |
0.3571 times |
Fri 17 October 2025 |
29.33 (0.96%) |
29.38 |
29.07 - 29.71 |
0.6542 times |
Fri 10 October 2025 |
29.05 (-2.71%) |
29.82 |
29.05 - 29.94 |
1.3014 times |
Fri 03 October 2025 |
29.86 (0.98%) |
29.69 |
29.59 - 31.18 |
1.3805 times |
Fri 26 September 2025 |
29.57 (-0.81%) |
29.84 |
29.44 - 29.89 |
2.0973 times |
Fri 19 September 2025 |
29.81 (2.02%) |
29.20 |
29.20 - 29.81 |
1.3496 times |
Fri 12 September 2025 |
29.22 (1.78%) |
28.77 |
28.77 - 29.41 |
0.9645 times |
Fri 05 September 2025 |
28.71 (0.03%) |
28.43 |
28.34 - 28.81 |
1.1627 times |
Fri 29 August 2025 |
28.70 (0%) |
28.68 |
28.64 - 28.72 |
0.1832 times |
Fri 29 August 2025 |
28.70 (0.63%) |
28.43 |
28.43 - 28.81 |
0.5496 times |
Fri 22 August 2025 |
28.52 (0.49%) |
28.35 |
28.10 - 28.63 |
0.729 times |
Monthly price and charts InspireTactical Strong monthly Stock price targets for InspireTactical RISN are 28.22 and 30.35 | Monthly Target 1 | 27.79 | | Monthly Target 2 | 28.65 | | Monthly Target 3 | 29.916666666667 | | Monthly Target 4 | 30.78 | | Monthly Target 5 | 32.05 |
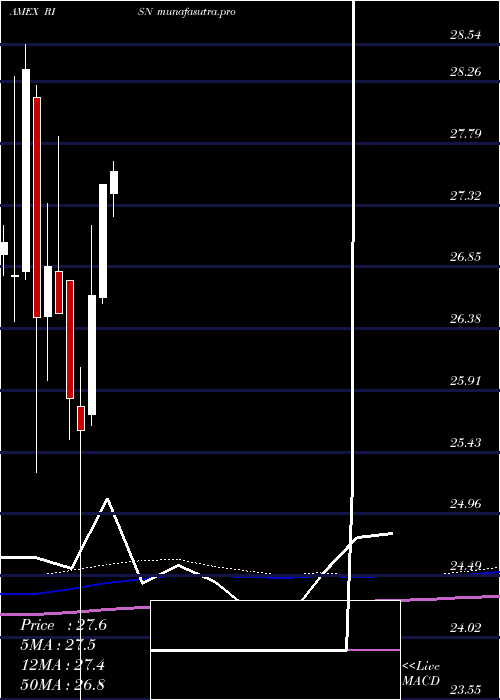
Monthly price and volumes Inspire Tactical
| Date |
Closing |
Open |
Range |
Volume |
Fri 24 October 2025 |
29.52 (-1.01%) |
29.72 |
29.05 - 31.18 |
0.4807 times |
Tue 30 September 2025 |
29.82 (3.9%) |
28.43 |
28.34 - 29.89 |
0.8434 times |
Fri 29 August 2025 |
28.70 (2.57%) |
27.79 |
27.79 - 28.81 |
0.517 times |
Thu 31 July 2025 |
27.98 (1.86%) |
27.41 |
27.23 - 28.39 |
0.9453 times |
Mon 30 June 2025 |
27.47 (3.15%) |
26.61 |
26.57 - 27.47 |
0.9764 times |
Fri 30 May 2025 |
26.63 (4.02%) |
25.72 |
25.64 - 27.16 |
0.4166 times |
Wed 30 April 2025 |
25.60 (-0.93%) |
25.78 |
23.55 - 26.08 |
0.8347 times |
Mon 31 March 2025 |
25.84 (-2.45%) |
26.74 |
25.53 - 26.74 |
0.7551 times |
Fri 28 February 2025 |
26.49 (-1.34%) |
26.81 |
26.49 - 27.84 |
0.5619 times |
Fri 31 January 2025 |
26.85 (1.47%) |
26.47 |
25.98 - 27.33 |
3.669 times |
Tue 31 December 2024 |
26.46 (-6.67%) |
28.14 |
25.28 - 28.23 |
0.5009 times |
DMA SMA EMA moving averages of Inspire Tactical RISN
DMA (daily moving average) of Inspire Tactical RISN
| DMA period | DMA value | | 5 day DMA | 29.43 | | 12 day DMA | 29.43 | | 20 day DMA | 29.56 | | 35 day DMA | 29.5 | | 50 day DMA | 29.21 | | 100 day DMA | 28.39 | | 150 day DMA | 27.49 | | 200 day DMA | 27.29 | EMA (exponential moving average) of Inspire Tactical RISN
| EMA period | EMA current | EMA prev | EMA prev2 | | 5 day EMA | 29.45 | 29.42 | 29.36 | | 12 day EMA | 29.47 | 29.46 | 29.44 | | 20 day EMA | 29.47 | 29.46 | 29.45 | | 35 day EMA | 29.31 | 29.3 | 29.29 | | 50 day EMA | 29.17 | 29.16 | 29.14 |
SMA (simple moving average) of Inspire Tactical RISN
| SMA period | SMA current | SMA prev | SMA prev2 | | 5 day SMA | 29.43 | 29.39 | 29.38 | | 12 day SMA | 29.43 | 29.46 | 29.46 | | 20 day SMA | 29.56 | 29.56 | 29.56 | | 35 day SMA | 29.5 | 29.48 | 29.46 | | 50 day SMA | 29.21 | 29.19 | 29.17 | | 100 day SMA | 28.39 | 28.37 | 28.34 | | 150 day SMA | 27.49 | 27.46 | 27.44 | | 200 day SMA | 27.29 | 27.28 | 27.26 |
|
|
