RiverfrontStrategic RIGS full analysis,charts,indicators,moving averages,SMA,DMA,EMA,ADX,MACD,RSIRiverfront Strategic RIGS WideScreen charts, DMA,SMA,EMA technical analysis, forecast prediction, by indicators ADX,MACD,RSI,CCI AMEX stock exchange
Daily price and charts and targets RiverfrontStrategic Strong Daily Stock price targets for RiverfrontStrategic RIGS are 23.23 and 23.28 | Daily Target 1 | 23.21 | | Daily Target 2 | 23.24 | | Daily Target 3 | 23.263333333333 | | Daily Target 4 | 23.29 | | Daily Target 5 | 23.31 |
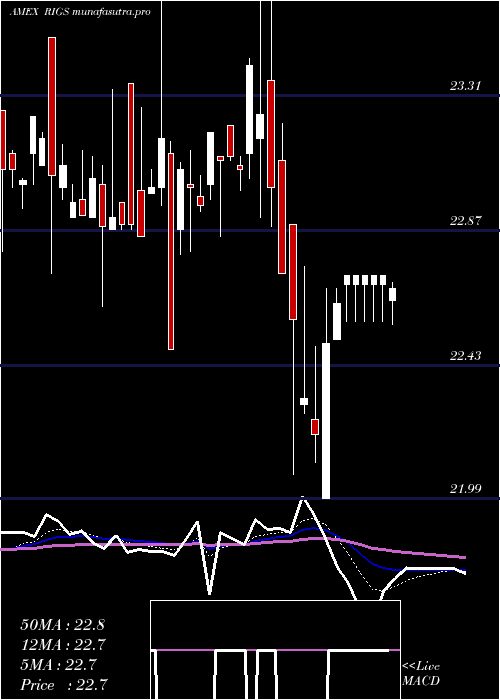
Daily price and volume Riverfront Strategic
| Date |
Closing |
Open |
Range |
Volume |
Thu 23 October 2025 |
23.26 (-0.43%) |
23.29 |
23.24 - 23.29 |
0.7704 times |
Wed 22 October 2025 |
23.36 (-0.09%) |
23.34 |
23.20 - 23.37 |
0.2423 times |
Tue 21 October 2025 |
23.38 (0.04%) |
23.37 |
23.26 - 23.41 |
2.3241 times |
Mon 20 October 2025 |
23.37 (1.39%) |
23.40 |
23.29 - 23.41 |
0.7621 times |
Fri 17 October 2025 |
23.05 (0.7%) |
23.50 |
23.05 - 23.50 |
0.2177 times |
Thu 16 October 2025 |
22.89 (-1.08%) |
23.29 |
22.89 - 23.33 |
0.3226 times |
Wed 15 October 2025 |
23.14 (-0.64%) |
23.29 |
22.61 - 23.47 |
1.3789 times |
Tue 14 October 2025 |
23.29 (0.34%) |
23.20 |
23.17 - 23.35 |
2.7114 times |
Mon 13 October 2025 |
23.21 (-0.09%) |
23.20 |
23.19 - 23.40 |
0.5578 times |
Fri 10 October 2025 |
23.23 (0.13%) |
23.28 |
23.15 - 23.31 |
0.7127 times |
Thu 09 October 2025 |
23.20 (0.13%) |
22.91 |
22.78 - 23.20 |
0.5113 times |
Weekly price and charts RiverfrontStrategic Strong weekly Stock price targets for RiverfrontStrategic RIGS are 23.13 and 23.34 | Weekly Target 1 | 23.08 | | Weekly Target 2 | 23.17 | | Weekly Target 3 | 23.29 | | Weekly Target 4 | 23.38 | | Weekly Target 5 | 23.5 |
Weekly price and volumes for Riverfront Strategic
| Date |
Closing |
Open |
Range |
Volume |
Thu 23 October 2025 |
23.26 (0.91%) |
23.40 |
23.20 - 23.41 |
0.6596 times |
Fri 17 October 2025 |
23.05 (-0.77%) |
23.20 |
22.61 - 23.50 |
0.8349 times |
Fri 10 October 2025 |
23.23 (-0.21%) |
23.21 |
22.78 - 23.58 |
0.784 times |
Fri 03 October 2025 |
23.28 (0%) |
23.22 |
22.80 - 23.50 |
0.5036 times |
Fri 26 September 2025 |
23.28 (-0.3%) |
23.35 |
23.20 - 24.13 |
0.4338 times |
Fri 19 September 2025 |
23.35 (-0.21%) |
23.02 |
22.87 - 24.32 |
3.0268 times |
Fri 12 September 2025 |
23.40 (0.73%) |
23.25 |
22.62 - 23.70 |
0.8302 times |
Fri 05 September 2025 |
23.23 (0.65%) |
23.16 |
22.50 - 23.70 |
0.5311 times |
Fri 29 August 2025 |
23.08 (0%) |
22.78 |
22.78 - 23.22 |
0.2393 times |
Fri 29 August 2025 |
23.08 (0.26%) |
23.08 |
22.78 - 23.22 |
2.1566 times |
Fri 22 August 2025 |
23.02 (-0.04%) |
22.89 |
22.89 - 23.20 |
0.6632 times |

Monthly price and charts RiverfrontStrategic Strong monthly Stock price targets for RiverfrontStrategic RIGS are 22.45 and 23.42 | Monthly Target 1 | 22.18 | | Monthly Target 2 | 22.72 | | Monthly Target 3 | 23.15 | | Monthly Target 4 | 23.69 | | Monthly Target 5 | 24.12 |
Monthly price and volumes Riverfront Strategic
| Date |
Closing |
Open |
Range |
Volume |
Thu 23 October 2025 |
23.26 (-0.09%) |
23.50 |
22.61 - 23.58 |
0.1611 times |
Tue 30 September 2025 |
23.28 (0.87%) |
23.16 |
22.50 - 24.32 |
0.3101 times |
Fri 29 August 2025 |
23.08 (0.22%) |
23.08 |
22.47 - 23.51 |
0.3052 times |
Thu 31 July 2025 |
23.03 (-0.99%) |
23.21 |
21.25 - 23.52 |
0.4758 times |
Mon 30 June 2025 |
23.26 (1.17%) |
22.79 |
22.56 - 23.70 |
1.6265 times |
Fri 30 May 2025 |
22.99 (-0.17%) |
22.79 |
22.16 - 23.28 |
2.059 times |
Wed 30 April 2025 |
23.03 (-0.3%) |
23.21 |
21.99 - 23.75 |
3.5213 times |
Mon 31 March 2025 |
23.10 (-0.6%) |
23.08 |
22.48 - 23.75 |
0.545 times |
Fri 28 February 2025 |
23.24 (1.57%) |
22.82 |
21.24 - 23.49 |
0.3453 times |
Fri 31 January 2025 |
22.88 (-1.04%) |
22.36 |
21.88 - 22.98 |
0.6507 times |
Tue 31 December 2024 |
23.12 (0.39%) |
22.90 |
22.50 - 23.35 |
0.4057 times |

DMA SMA EMA moving averages of Riverfront Strategic RIGS
DMA (daily moving average) of Riverfront Strategic RIGS
| DMA period | DMA value | | 5 day DMA | 23.28 | | 12 day DMA | 23.21 | | 20 day DMA | 23.23 | | 35 day DMA | 23.31 | | 50 day DMA | 23.24 | | 100 day DMA | 23.13 | | 150 day DMA | 23.03 | | 200 day DMA | 23 | EMA (exponential moving average) of Riverfront Strategic RIGS
| EMA period | EMA current | EMA prev | EMA prev2 | | 5 day EMA | 23.28 | 23.29 | 23.25 | | 12 day EMA | 23.25 | 23.25 | 23.23 | | 20 day EMA | 23.25 | 23.25 | 23.24 | | 35 day EMA | 23.23 | 23.23 | 23.22 | | 50 day EMA | 23.24 | 23.24 | 23.23 |
SMA (simple moving average) of Riverfront Strategic RIGS
| SMA period | SMA current | SMA prev | SMA prev2 | | 5 day SMA | 23.28 | 23.21 | 23.17 | | 12 day SMA | 23.21 | 23.24 | 23.23 | | 20 day SMA | 23.23 | 23.23 | 23.22 | | 35 day SMA | 23.31 | 23.31 | 23.31 | | 50 day SMA | 23.24 | 23.24 | 23.23 | | 100 day SMA | 23.13 | 23.13 | 23.12 | | 150 day SMA | 23.03 | 23.02 | 23.02 | | 200 day SMA | 23 | 22.99 | 22.99 |
|
|
