SP RFG full analysis,charts,indicators,moving averages,SMA,DMA,EMA,ADX,MACD,RSIS P RFG WideScreen charts, DMA,SMA,EMA technical analysis, forecast prediction, by indicators ADX,MACD,RSI,CCI AMEX stock exchange
Daily price and charts and targets SP Strong Daily Stock price targets for SP RFG are 52.28 and 52.43 | Daily Target 1 | 52.25 | | Daily Target 2 | 52.3 | | Daily Target 3 | 52.4 | | Daily Target 4 | 52.45 | | Daily Target 5 | 52.55 |
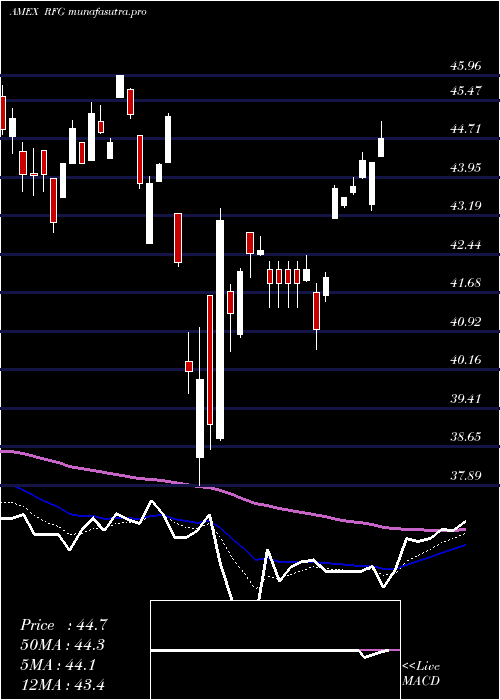
Daily price and volume S P
| Date |
Closing |
Open |
Range |
Volume |
Fri 24 October 2025 |
52.35 (1.1%) |
52.50 |
52.35 - 52.50 |
0.6819 times |
Thu 23 October 2025 |
51.78 (2.09%) |
50.92 |
50.92 - 51.84 |
0.8111 times |
Wed 22 October 2025 |
50.72 (-0.82%) |
50.77 |
50.57 - 50.77 |
0.3293 times |
Tue 21 October 2025 |
51.14 (0.89%) |
50.58 |
50.58 - 51.18 |
1.4636 times |
Mon 20 October 2025 |
50.69 (1.04%) |
50.45 |
50.45 - 50.78 |
1.075 times |
Fri 17 October 2025 |
50.17 (-0.14%) |
50.21 |
49.85 - 50.21 |
1.1803 times |
Thu 16 October 2025 |
50.24 (-1.41%) |
51.05 |
50.06 - 51.13 |
0.9511 times |
Wed 15 October 2025 |
50.96 (0.28%) |
51.26 |
50.41 - 51.26 |
1.4889 times |
Tue 14 October 2025 |
50.82 (0.61%) |
50.48 |
50.41 - 51.10 |
1.287 times |
Mon 13 October 2025 |
50.51 (1.9%) |
50.24 |
50.24 - 50.54 |
0.7318 times |
Fri 10 October 2025 |
49.57 (-2.59%) |
51.02 |
49.56 - 51.03 |
2.5992 times |
Weekly price and charts SP Strong weekly Stock price targets for SP RFG are 51.4 and 53.45 | Weekly Target 1 | 49.72 | | Weekly Target 2 | 51.03 | | Weekly Target 3 | 51.766666666667 | | Weekly Target 4 | 53.08 | | Weekly Target 5 | 53.82 |
Weekly price and volumes for S P
| Date |
Closing |
Open |
Range |
Volume |
Fri 24 October 2025 |
52.35 (4.35%) |
50.45 |
50.45 - 52.50 |
0.5056 times |
Fri 17 October 2025 |
50.17 (1.21%) |
50.24 |
49.85 - 51.26 |
0.6537 times |
Fri 10 October 2025 |
49.57 (-3.01%) |
51.14 |
49.56 - 51.48 |
1.7284 times |
Fri 03 October 2025 |
51.11 (0.1%) |
51.11 |
50.60 - 51.44 |
1.5654 times |
Fri 26 September 2025 |
51.06 (-0.74%) |
51.17 |
50.11 - 51.58 |
1.4482 times |
Fri 19 September 2025 |
51.44 (0.49%) |
51.24 |
50.56 - 51.83 |
1.1702 times |
Fri 12 September 2025 |
51.19 (-0.1%) |
51.38 |
50.55 - 51.65 |
0.746 times |
Fri 05 September 2025 |
51.24 (1.63%) |
49.81 |
49.78 - 51.47 |
0.7606 times |
Fri 29 August 2025 |
50.42 (0%) |
50.87 |
50.27 - 50.87 |
0.0556 times |
Fri 29 August 2025 |
50.42 (-0.45%) |
50.50 |
50.16 - 50.87 |
1.3662 times |
Fri 22 August 2025 |
50.65 (1.67%) |
49.88 |
49.19 - 50.87 |
1.6851 times |

Monthly price and charts SP Strong monthly Stock price targets for SP RFG are 50.96 and 53.9 | Monthly Target 1 | 48.53 | | Monthly Target 2 | 50.44 | | Monthly Target 3 | 51.47 | | Monthly Target 4 | 53.38 | | Monthly Target 5 | 54.41 |
Monthly price and volumes S P
| Date |
Closing |
Open |
Range |
Volume |
Fri 24 October 2025 |
52.35 (2.75%) |
50.95 |
49.56 - 52.50 |
0.4726 times |
Tue 30 September 2025 |
50.95 (1.05%) |
49.81 |
49.78 - 51.83 |
0.6585 times |
Fri 29 August 2025 |
50.42 (0.12%) |
49.75 |
49.19 - 50.89 |
0.608 times |
Thu 31 July 2025 |
50.36 (3.3%) |
48.69 |
48.51 - 51.74 |
0.5686 times |
Mon 30 June 2025 |
48.75 (2.18%) |
47.56 |
46.80 - 48.91 |
0.7133 times |
Fri 30 May 2025 |
47.71 (7.84%) |
44.36 |
44.36 - 48.62 |
1.2827 times |
Wed 30 April 2025 |
44.24 (0.94%) |
43.86 |
37.89 - 45.20 |
1.6616 times |
Mon 31 March 2025 |
43.83 (-7%) |
47.47 |
42.64 - 47.47 |
1.3914 times |
Fri 28 February 2025 |
47.13 (-5.93%) |
49.30 |
46.43 - 50.83 |
1.4764 times |
Fri 31 January 2025 |
50.10 (3.47%) |
48.90 |
48.28 - 51.80 |
1.1668 times |
Tue 31 December 2024 |
48.42 (-8.87%) |
52.85 |
48.08 - 53.06 |
1.0124 times |

DMA SMA EMA moving averages of S P RFG
DMA (daily moving average) of S P RFG
| DMA period | DMA value | | 5 day DMA | 51.34 | | 12 day DMA | 50.82 | | 20 day DMA | 50.95 | | 35 day DMA | 51.02 | | 50 day DMA | 50.81 | | 100 day DMA | 50.07 | | 150 day DMA | 48.28 | | 200 day DMA | 48.26 | EMA (exponential moving average) of S P RFG
| EMA period | EMA current | EMA prev | EMA prev2 | | 5 day EMA | 51.5 | 51.08 | 50.73 | | 12 day EMA | 51.11 | 50.89 | 50.73 | | 20 day EMA | 51.01 | 50.87 | 50.77 | | 35 day EMA | 50.87 | 50.78 | 50.72 | | 50 day EMA | 50.81 | 50.75 | 50.71 |
SMA (simple moving average) of S P RFG
| SMA period | SMA current | SMA prev | SMA prev2 | | 5 day SMA | 51.34 | 50.9 | 50.59 | | 12 day SMA | 50.82 | 50.74 | 50.67 | | 20 day SMA | 50.95 | 50.88 | 50.81 | | 35 day SMA | 51.02 | 50.99 | 50.96 | | 50 day SMA | 50.81 | 50.76 | 50.73 | | 100 day SMA | 50.07 | 50.02 | 49.98 | | 150 day SMA | 48.28 | 48.23 | 48.18 | | 200 day SMA | 48.26 | 48.24 | 48.23 |
|
|
