RiverfrontDynamic RFFC full analysis,charts,indicators,moving averages,SMA,DMA,EMA,ADX,MACD,RSIRiverfront Dynamic RFFC WideScreen charts, DMA,SMA,EMA technical analysis, forecast prediction, by indicators ADX,MACD,RSI,CCI AMEX stock exchange
Daily price and charts and targets RiverfrontDynamic Strong Daily Stock price targets for RiverfrontDynamic RFFC are 65.73 and 65.73 | Daily Target 1 | 65.73 | | Daily Target 2 | 65.73 | | Daily Target 3 | 65.73 | | Daily Target 4 | 65.73 | | Daily Target 5 | 65.73 |
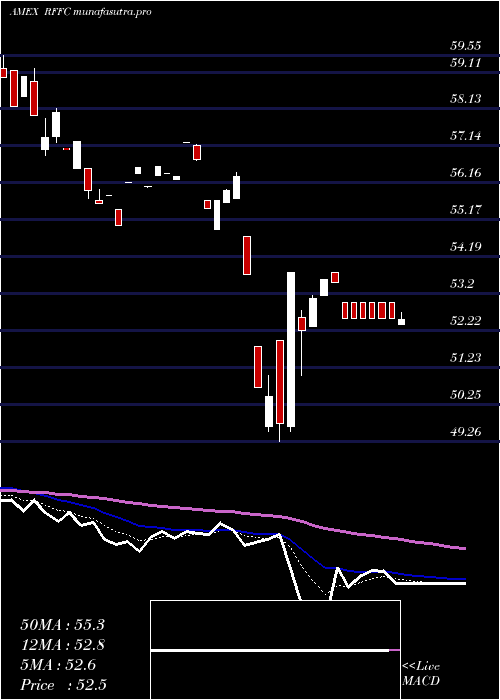
Daily price and volume Riverfront Dynamic
| Date |
Closing |
Open |
Range |
Volume |
Fri 24 October 2025 |
65.73 (1.06%) |
65.73 |
65.73 - 65.73 |
0.0994 times |
Thu 23 October 2025 |
65.04 (0%) |
65.18 |
65.18 - 65.18 |
0 times |
Wed 22 October 2025 |
65.04 (-0.05%) |
64.87 |
64.87 - 64.87 |
0 times |
Tue 21 October 2025 |
65.07 (0.18%) |
65.08 |
64.99 - 65.14 |
5.9657 times |
Mon 20 October 2025 |
64.95 (0.98%) |
64.78 |
64.78 - 64.95 |
0.1203 times |
Fri 17 October 2025 |
64.32 (0.52%) |
64.06 |
64.06 - 64.32 |
0.0497 times |
Thu 16 October 2025 |
63.99 (-0.51%) |
63.85 |
63.78 - 63.99 |
1.5774 times |
Wed 15 October 2025 |
64.32 (0.41%) |
64.72 |
63.97 - 64.72 |
0.1989 times |
Tue 14 October 2025 |
64.06 (0.09%) |
63.27 |
63.27 - 64.33 |
0.2486 times |
Mon 13 October 2025 |
64.00 (1.57%) |
63.77 |
63.74 - 64.11 |
1.74 times |
Fri 10 October 2025 |
63.01 (-2.43%) |
64.00 |
63.01 - 64.00 |
0.0994 times |
Weekly price and charts RiverfrontDynamic Strong weekly Stock price targets for RiverfrontDynamic RFFC are 65.26 and 66.21 | Weekly Target 1 | 64.46 | | Weekly Target 2 | 65.1 | | Weekly Target 3 | 65.413333333333 | | Weekly Target 4 | 66.05 | | Weekly Target 5 | 66.36 |
Weekly price and volumes for Riverfront Dynamic
| Date |
Closing |
Open |
Range |
Volume |
Fri 24 October 2025 |
65.73 (2.19%) |
64.78 |
64.78 - 65.73 |
2.656 times |
Fri 17 October 2025 |
64.32 (2.08%) |
63.77 |
63.27 - 64.72 |
1.638 times |
Fri 10 October 2025 |
63.01 (-2.45%) |
64.82 |
63.01 - 64.87 |
0.7258 times |
Fri 03 October 2025 |
64.59 (1.22%) |
63.84 |
63.84 - 64.74 |
0.6253 times |
Fri 26 September 2025 |
63.81 (-0.31%) |
64.23 |
63.48 - 64.24 |
0.3416 times |
Fri 19 September 2025 |
64.01 (0.96%) |
63.74 |
61.93 - 64.01 |
0.7685 times |
Fri 12 September 2025 |
63.40 (1.28%) |
64.60 |
62.70 - 64.60 |
0.8112 times |
Fri 05 September 2025 |
62.60 (0.51%) |
61.91 |
61.91 - 62.79 |
0.5337 times |
Fri 29 August 2025 |
62.28 (0%) |
62.28 |
62.28 - 62.28 |
0.0213 times |
Fri 29 August 2025 |
62.28 (-0.06%) |
62.13 |
62.09 - 62.70 |
1.8786 times |
Fri 22 August 2025 |
62.32 (0.61%) |
61.99 |
61.46 - 62.39 |
0.2775 times |

Monthly price and charts RiverfrontDynamic Strong monthly Stock price targets for RiverfrontDynamic RFFC are 64.37 and 67.09 | Monthly Target 1 | 62.1 | | Monthly Target 2 | 63.92 | | Monthly Target 3 | 64.823333333333 | | Monthly Target 4 | 66.64 | | Monthly Target 5 | 67.54 |
Monthly price and volumes Riverfront Dynamic
| Date |
Closing |
Open |
Range |
Volume |
Fri 24 October 2025 |
65.73 (2.32%) |
64.59 |
63.01 - 65.73 |
0.2867 times |
Tue 30 September 2025 |
64.24 (3.15%) |
61.91 |
61.91 - 64.60 |
0.146 times |
Fri 29 August 2025 |
62.28 (0.92%) |
60.77 |
60.60 - 62.70 |
0.1733 times |
Thu 31 July 2025 |
61.71 (2.61%) |
60.03 |
60.00 - 62.26 |
0.2202 times |
Mon 30 June 2025 |
60.14 (4.1%) |
57.61 |
57.41 - 60.14 |
0.2817 times |
Fri 30 May 2025 |
57.77 (5.3%) |
55.48 |
55.31 - 58.26 |
0.3798 times |
Wed 30 April 2025 |
54.86 (-1.49%) |
55.64 |
49.26 - 56.42 |
3.1295 times |
Mon 31 March 2025 |
55.69 (-5.61%) |
58.85 |
54.92 - 59.21 |
5.004 times |
Fri 28 February 2025 |
59.00 (-2.3%) |
59.34 |
58.18 - 61.07 |
0.2018 times |
Fri 31 January 2025 |
60.39 (4.28%) |
57.86 |
57.66 - 60.98 |
0.177 times |
Tue 31 December 2024 |
57.91 (-3.79%) |
60.52 |
57.91 - 60.54 |
0.1377 times |

DMA SMA EMA moving averages of Riverfront Dynamic RFFC
DMA (daily moving average) of Riverfront Dynamic RFFC
| DMA period | DMA value | | 5 day DMA | 65.17 | | 12 day DMA | 64.51 | | 20 day DMA | 64.5 | | 35 day DMA | 64.1 | | 50 day DMA | 63.53 | | 100 day DMA | 61.9 | | 150 day DMA | 59.59 | | 200 day DMA | 59.43 | EMA (exponential moving average) of Riverfront Dynamic RFFC
| EMA period | EMA current | EMA prev | EMA prev2 | | 5 day EMA | 65.15 | 64.86 | 64.77 | | 12 day EMA | 64.76 | 64.58 | 64.5 | | 20 day EMA | 64.49 | 64.36 | 64.29 | | 35 day EMA | 64.01 | 63.91 | 63.84 | | 50 day EMA | 63.58 | 63.49 | 63.43 |
SMA (simple moving average) of Riverfront Dynamic RFFC
| SMA period | SMA current | SMA prev | SMA prev2 | | 5 day SMA | 65.17 | 64.88 | 64.67 | | 12 day SMA | 64.51 | 64.44 | 64.39 | | 20 day SMA | 64.5 | 64.4 | 64.32 | | 35 day SMA | 64.1 | 64.01 | 63.95 | | 50 day SMA | 63.53 | 63.46 | 63.4 | | 100 day SMA | 61.9 | 61.82 | 61.74 | | 150 day SMA | 59.59 | 59.54 | 59.48 | | 200 day SMA | 59.43 | 59.39 | 59.36 |
|
|
