RiverfrontDynamic RFDA full analysis,charts,indicators,moving averages,SMA,DMA,EMA,ADX,MACD,RSIRiverfront Dynamic RFDA WideScreen charts, DMA,SMA,EMA technical analysis, forecast prediction, by indicators ADX,MACD,RSI,CCI AMEX stock exchange
Daily price and charts and targets RiverfrontDynamic Strong Daily Stock price targets for RiverfrontDynamic RFDA are 63.36 and 63.58 | Daily Target 1 | 63.18 | | Daily Target 2 | 63.31 | | Daily Target 3 | 63.396666666667 | | Daily Target 4 | 63.53 | | Daily Target 5 | 63.62 |
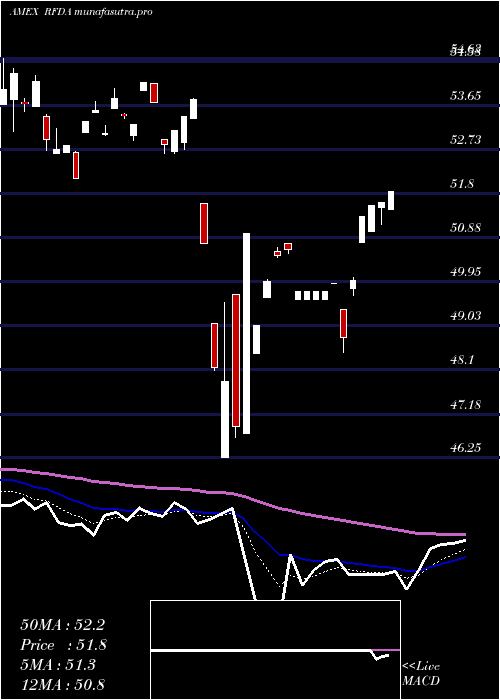
Daily price and volume Riverfront Dynamic
| Date |
Closing |
Open |
Range |
Volume |
Fri 24 October 2025 |
63.45 (1.31%) |
63.38 |
63.26 - 63.48 |
0.3135 times |
Thu 23 October 2025 |
62.63 (-0.16%) |
62.70 |
62.63 - 62.81 |
1.7716 times |
Wed 22 October 2025 |
62.73 (-0.13%) |
62.83 |
62.31 - 62.83 |
5.9582 times |
Tue 21 October 2025 |
62.81 (0.06%) |
62.71 |
62.71 - 62.81 |
0.1997 times |
Mon 20 October 2025 |
62.77 (0.92%) |
62.52 |
62.52 - 62.82 |
0.346 times |
Fri 17 October 2025 |
62.20 (0.5%) |
62.13 |
62.13 - 62.20 |
0.0424 times |
Thu 16 October 2025 |
61.89 (-0.86%) |
62.76 |
61.89 - 62.76 |
0.4698 times |
Wed 15 October 2025 |
62.43 (-0.57%) |
63.34 |
62.28 - 63.34 |
0.3495 times |
Tue 14 October 2025 |
62.79 (0.11%) |
62.09 |
62.09 - 62.79 |
0.1248 times |
Mon 13 October 2025 |
62.72 (1.51%) |
62.56 |
62.35 - 62.72 |
0.4244 times |
Fri 10 October 2025 |
61.79 (-2.66%) |
63.66 |
61.79 - 63.71 |
0.2996 times |
Weekly price and charts RiverfrontDynamic Strong weekly Stock price targets for RiverfrontDynamic RFDA are 62.88 and 64.05 | Weekly Target 1 | 61.91 | | Weekly Target 2 | 62.68 | | Weekly Target 3 | 63.08 | | Weekly Target 4 | 63.85 | | Weekly Target 5 | 64.25 |
Weekly price and volumes for Riverfront Dynamic
| Date |
Closing |
Open |
Range |
Volume |
Fri 24 October 2025 |
63.45 (2.01%) |
62.52 |
62.31 - 63.48 |
3.3332 times |
Fri 17 October 2025 |
62.20 (0.66%) |
62.56 |
61.89 - 63.34 |
0.5475 times |
Fri 10 October 2025 |
61.79 (-2.4%) |
63.46 |
61.79 - 63.71 |
0.3783 times |
Fri 03 October 2025 |
63.31 (1.18%) |
62.81 |
62.44 - 63.59 |
0.6648 times |
Fri 26 September 2025 |
62.57 (0.06%) |
62.09 |
62.09 - 63.01 |
1.2981 times |
Fri 19 September 2025 |
62.53 (1.08%) |
62.01 |
61.81 - 62.53 |
0.8428 times |
Fri 12 September 2025 |
61.86 (0.9%) |
62.05 |
61.26 - 62.05 |
0.5909 times |
Fri 05 September 2025 |
61.31 (0.02%) |
60.57 |
60.56 - 61.70 |
0.7362 times |
Fri 29 August 2025 |
61.30 (0%) |
61.29 |
61.24 - 61.30 |
0.5812 times |
Fri 29 August 2025 |
61.30 (0.36%) |
61.17 |
61.00 - 61.61 |
1.0269 times |
Fri 22 August 2025 |
61.08 (1.29%) |
60.22 |
59.60 - 61.10 |
0.6491 times |

Monthly price and charts RiverfrontDynamic Strong monthly Stock price targets for RiverfrontDynamic RFDA are 62.62 and 64.54 | Monthly Target 1 | 61.06 | | Monthly Target 2 | 62.26 | | Monthly Target 3 | 62.983333333333 | | Monthly Target 4 | 64.18 | | Monthly Target 5 | 64.9 |
Monthly price and volumes Riverfront Dynamic
| Date |
Closing |
Open |
Range |
Volume |
Fri 24 October 2025 |
63.45 (0.79%) |
62.76 |
61.79 - 63.71 |
0.8195 times |
Tue 30 September 2025 |
62.95 (2.69%) |
60.57 |
60.56 - 63.01 |
0.6742 times |
Fri 29 August 2025 |
61.30 (3.79%) |
58.53 |
58.07 - 61.61 |
0.5466 times |
Thu 31 July 2025 |
59.06 (1.81%) |
58.06 |
57.98 - 59.78 |
0.4365 times |
Mon 30 June 2025 |
58.01 (5.84%) |
54.88 |
54.88 - 58.01 |
0.1828 times |
Fri 30 May 2025 |
54.81 (6.1%) |
52.40 |
52.24 - 55.42 |
0.4449 times |
Wed 30 April 2025 |
51.66 (-2.75%) |
52.88 |
46.25 - 53.80 |
2.427 times |
Mon 31 March 2025 |
53.12 (-4.53%) |
55.53 |
52.12 - 55.53 |
3.2323 times |
Fri 28 February 2025 |
55.64 (-1%) |
55.64 |
54.89 - 57.35 |
0.5587 times |
Fri 31 January 2025 |
56.20 (0.52%) |
56.30 |
54.52 - 57.36 |
0.6777 times |
Tue 31 December 2024 |
55.91 (-4%) |
58.20 |
55.61 - 58.65 |
0.542 times |

DMA SMA EMA moving averages of Riverfront Dynamic RFDA
DMA (daily moving average) of Riverfront Dynamic RFDA
| DMA period | DMA value | | 5 day DMA | 62.88 | | 12 day DMA | 62.64 | | 20 day DMA | 62.85 | | 35 day DMA | 62.53 | | 50 day DMA | 62.05 | | 100 day DMA | 60.13 | | 150 day DMA | 57.52 | | 200 day DMA | 57.02 | EMA (exponential moving average) of Riverfront Dynamic RFDA
| EMA period | EMA current | EMA prev | EMA prev2 | | 5 day EMA | 62.91 | 62.64 | 62.64 | | 12 day EMA | 62.77 | 62.65 | 62.65 | | 20 day EMA | 62.67 | 62.59 | 62.59 | | 35 day EMA | 62.34 | 62.27 | 62.25 | | 50 day EMA | 62.01 | 61.95 | 61.92 |
SMA (simple moving average) of Riverfront Dynamic RFDA
| SMA period | SMA current | SMA prev | SMA prev2 | | 5 day SMA | 62.88 | 62.63 | 62.48 | | 12 day SMA | 62.64 | 62.65 | 62.7 | | 20 day SMA | 62.85 | 62.81 | 62.79 | | 35 day SMA | 62.53 | 62.47 | 62.44 | | 50 day SMA | 62.05 | 61.99 | 61.95 | | 100 day SMA | 60.13 | 60.04 | 59.97 | | 150 day SMA | 57.52 | 57.45 | 57.39 | | 200 day SMA | 57.02 | 56.98 | 56.95 |
|
|
