MsciUsa QUAL full analysis,charts,indicators,moving averages,SMA,DMA,EMA,ADX,MACD,RSIMsci Usa QUAL WideScreen charts, DMA,SMA,EMA technical analysis, forecast prediction, by indicators ADX,MACD,RSI,CCI AMEX stock exchange
Daily price and charts and targets MsciUsa Strong Daily Stock price targets for MsciUsa QUAL are 195.51 and 197.07 | Daily Target 1 | 194.28 | | Daily Target 2 | 195.18 | | Daily Target 3 | 195.84 | | Daily Target 4 | 196.74 | | Daily Target 5 | 197.4 |
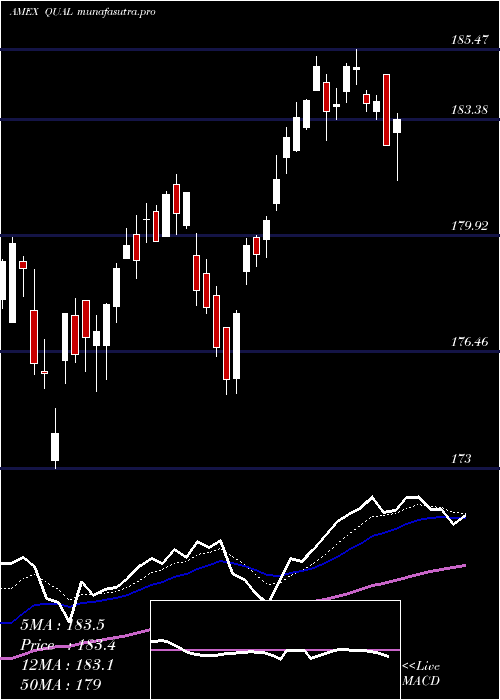
Daily price and volume Msci Usa
| Date |
Closing |
Open |
Range |
Volume |
Thu 23 October 2025 |
196.08 (0.61%) |
194.94 |
194.94 - 196.50 |
1.1345 times |
Wed 22 October 2025 |
194.90 (-0.63%) |
195.81 |
193.98 - 196.12 |
1.2608 times |
Tue 21 October 2025 |
196.13 (0.27%) |
195.36 |
195.26 - 196.55 |
0.982 times |
Mon 20 October 2025 |
195.60 (1.11%) |
194.27 |
194.27 - 195.97 |
0.4856 times |
Fri 17 October 2025 |
193.46 (0.61%) |
191.66 |
191.66 - 193.82 |
0.877 times |
Thu 16 October 2025 |
192.29 (-0.73%) |
193.77 |
191.23 - 194.16 |
1.1436 times |
Wed 15 October 2025 |
193.71 (0.35%) |
194.33 |
192.17 - 195.25 |
0.9132 times |
Tue 14 October 2025 |
193.03 (0.08%) |
191.10 |
190.74 - 193.85 |
1.0363 times |
Mon 13 October 2025 |
192.88 (0.98%) |
192.79 |
192.07 - 193.33 |
0.8241 times |
Fri 10 October 2025 |
191.01 (-2.43%) |
196.12 |
190.90 - 196.48 |
1.3428 times |
Thu 09 October 2025 |
195.77 (-0.47%) |
196.89 |
195.38 - 197.01 |
0.9816 times |
Weekly price and charts MsciUsa Strong weekly Stock price targets for MsciUsa QUAL are 195.03 and 197.6 | Weekly Target 1 | 192.97 | | Weekly Target 2 | 194.52 | | Weekly Target 3 | 195.53666666667 | | Weekly Target 4 | 197.09 | | Weekly Target 5 | 198.11 |
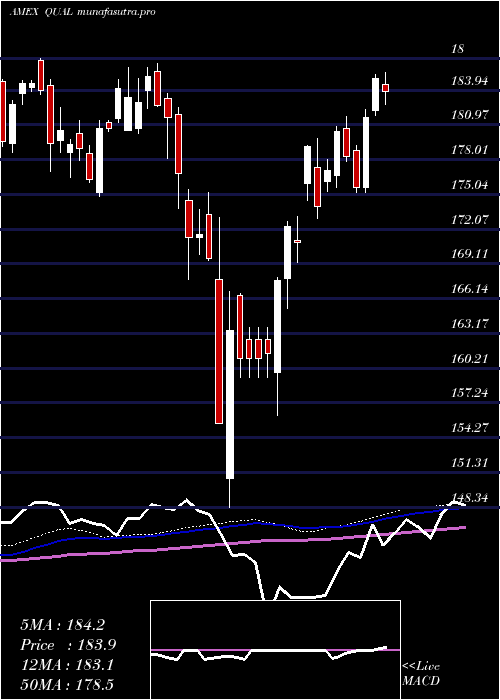
Weekly price and volumes for Msci Usa
| Date |
Closing |
Open |
Range |
Volume |
Thu 23 October 2025 |
196.08 (1.35%) |
194.27 |
193.98 - 196.55 |
0.6117 times |
Fri 17 October 2025 |
193.46 (1.28%) |
192.79 |
190.74 - 195.25 |
0.7592 times |
Fri 10 October 2025 |
191.01 (-2.78%) |
196.32 |
190.90 - 197.37 |
0.8598 times |
Fri 03 October 2025 |
196.47 (2.01%) |
193.30 |
192.93 - 197.50 |
1.1046 times |
Fri 26 September 2025 |
192.60 (-0.06%) |
192.36 |
190.37 - 194.00 |
1.0225 times |
Fri 19 September 2025 |
192.71 (1%) |
191.16 |
190.07 - 193.16 |
3.5858 times |
Fri 12 September 2025 |
190.81 (0.84%) |
189.76 |
189.10 - 191.76 |
0.8427 times |
Fri 05 September 2025 |
189.22 (0.14%) |
186.74 |
186.19 - 190.64 |
0.6064 times |
Fri 29 August 2025 |
188.95 (0%) |
189.22 |
188.50 - 189.47 |
0.1008 times |
Fri 29 August 2025 |
188.95 (-0.22%) |
188.95 |
188.33 - 189.84 |
0.5065 times |
Fri 22 August 2025 |
189.37 (0.67%) |
187.98 |
185.96 - 189.75 |
1.0071 times |
Monthly price and charts MsciUsa Strong monthly Stock price targets for MsciUsa QUAL are 193.41 and 200.17 | Monthly Target 1 | 188.01 | | Monthly Target 2 | 192.05 | | Monthly Target 3 | 194.77333333333 | | Monthly Target 4 | 198.81 | | Monthly Target 5 | 201.53 |
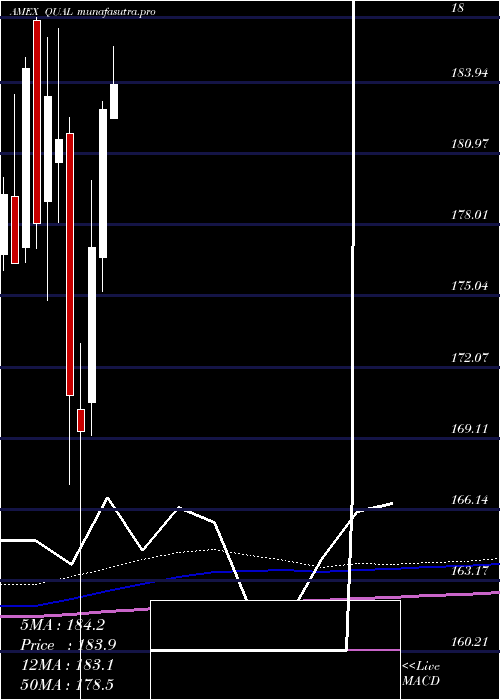
Monthly price and volumes Msci Usa
| Date |
Closing |
Open |
Range |
Volume |
Thu 23 October 2025 |
196.08 (0.81%) |
193.83 |
190.74 - 197.50 |
0.6635 times |
Tue 30 September 2025 |
194.50 (2.94%) |
186.74 |
186.19 - 194.62 |
1.4318 times |
Fri 29 August 2025 |
188.95 (2.62%) |
183.08 |
181.65 - 189.84 |
0.6964 times |
Thu 31 July 2025 |
184.12 (0.71%) |
182.46 |
181.55 - 187.38 |
0.9365 times |
Mon 30 June 2025 |
182.82 (3.25%) |
176.65 |
175.20 - 183.13 |
0.6726 times |
Fri 30 May 2025 |
177.06 (4.54%) |
170.61 |
169.23 - 179.85 |
0.9857 times |
Wed 30 April 2025 |
169.37 (-0.89%) |
170.28 |
148.34 - 173.06 |
1.446 times |
Mon 31 March 2025 |
170.89 (-5.88%) |
181.83 |
167.18 - 182.49 |
1.1288 times |
Fri 28 February 2025 |
181.57 (-0.98%) |
180.63 |
178.11 - 186.21 |
0.9903 times |
Fri 31 January 2025 |
183.36 (2.96%) |
179.00 |
174.85 - 185.85 |
1.0484 times |
Tue 31 December 2024 |
178.08 (-3.51%) |
186.52 |
177.02 - 186.66 |
0.5773 times |
DMA SMA EMA moving averages of Msci Usa QUAL
DMA (daily moving average) of Msci Usa QUAL
| DMA period | DMA value | | 5 day DMA | 195.23 | | 12 day DMA | 194.3 | | 20 day DMA | 194.67 | | 35 day DMA | 193.22 | | 50 day DMA | 191.81 | | 100 day DMA | 187.33 | | 150 day DMA | 181.31 | | 200 day DMA | 181.01 | EMA (exponential moving average) of Msci Usa QUAL
| EMA period | EMA current | EMA prev | EMA prev2 | | 5 day EMA | 195.22 | 194.79 | 194.74 | | 12 day EMA | 194.64 | 194.38 | 194.29 | | 20 day EMA | 194.19 | 193.99 | 193.89 | | 35 day EMA | 193.02 | 192.84 | 192.72 | | 50 day EMA | 191.78 | 191.6 | 191.47 |
SMA (simple moving average) of Msci Usa QUAL
| SMA period | SMA current | SMA prev | SMA prev2 | | 5 day SMA | 195.23 | 194.48 | 194.24 | | 12 day SMA | 194.3 | 194.27 | 194.43 | | 20 day SMA | 194.67 | 194.43 | 194.29 | | 35 day SMA | 193.22 | 193.05 | 192.87 | | 50 day SMA | 191.81 | 191.66 | 191.54 | | 100 day SMA | 187.33 | 187.14 | 186.96 | | 150 day SMA | 181.31 | 181.15 | 180.99 | | 200 day SMA | 181.01 | 180.92 | 180.85 |
|
|
