UltraQqq QLD full analysis,charts,indicators,moving averages,SMA,DMA,EMA,ADX,MACD,RSIUltra Qqq QLD WideScreen charts, DMA,SMA,EMA technical analysis, forecast prediction, by indicators ADX,MACD,RSI,CCI AMEX stock exchange
Daily price and charts and targets UltraQqq Strong Daily Stock price targets for UltraQqq QLD are 142.97 and 145.69 | Daily Target 1 | 140.81 | | Daily Target 2 | 142.41 | | Daily Target 3 | 143.52666666667 | | Daily Target 4 | 145.13 | | Daily Target 5 | 146.25 |
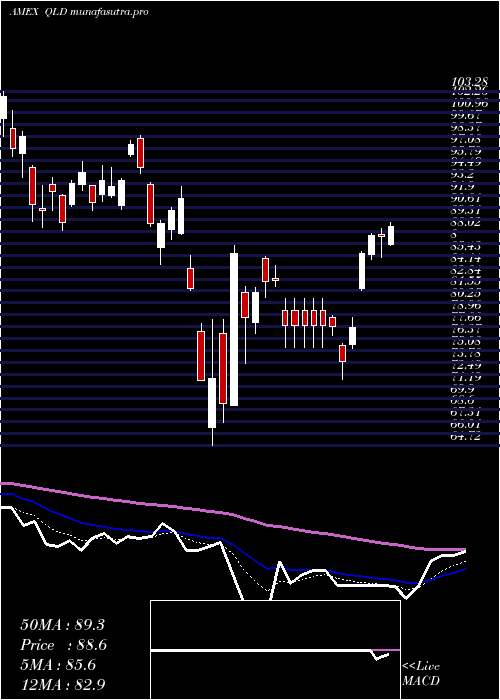
Daily price and volume Ultra Qqq
| Date |
Closing |
Open |
Range |
Volume |
Fri 24 October 2025 |
144.02 (2.08%) |
142.06 |
141.92 - 144.64 |
0.9721 times |
Thu 23 October 2025 |
141.09 (1.69%) |
139.30 |
137.62 - 141.44 |
0.6584 times |
Wed 22 October 2025 |
138.74 (-1.97%) |
141.23 |
136.12 - 141.50 |
1.1473 times |
Tue 21 October 2025 |
141.53 (-0.06%) |
141.64 |
140.58 - 142.14 |
0.7617 times |
Mon 20 October 2025 |
141.61 (2.5%) |
139.65 |
138.78 - 142.18 |
0.6693 times |
Fri 17 October 2025 |
138.16 (1.28%) |
132.59 |
131.93 - 138.87 |
1.0072 times |
Thu 16 October 2025 |
136.42 (-0.74%) |
138.67 |
134.39 - 140.20 |
1.1545 times |
Wed 15 October 2025 |
137.44 (1.36%) |
138.28 |
134.61 - 139.49 |
1.0684 times |
Tue 14 October 2025 |
135.60 (-1.33%) |
134.34 |
131.95 - 137.70 |
1.3527 times |
Mon 13 October 2025 |
137.43 (4.26%) |
136.37 |
135.31 - 137.84 |
1.2084 times |
Fri 10 October 2025 |
131.81 (-7.01%) |
142.01 |
131.64 - 142.82 |
1.6027 times |
Weekly price and charts UltraQqq Strong weekly Stock price targets for UltraQqq QLD are 140.07 and 148.59 | Weekly Target 1 | 133.07 | | Weekly Target 2 | 138.55 | | Weekly Target 3 | 141.59333333333 | | Weekly Target 4 | 147.07 | | Weekly Target 5 | 150.11 |
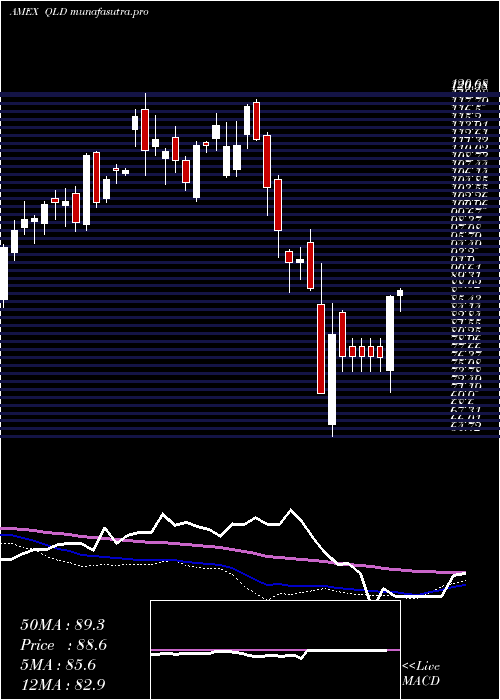
Weekly price and volumes for Ultra Qqq
| Date |
Closing |
Open |
Range |
Volume |
Fri 24 October 2025 |
144.02 (4.24%) |
139.65 |
136.12 - 144.64 |
0.9929 times |
Fri 17 October 2025 |
138.16 (4.82%) |
136.37 |
131.93 - 140.20 |
1.3662 times |
Fri 10 October 2025 |
131.81 (-4.75%) |
139.34 |
131.64 - 142.82 |
0.8114 times |
Fri 03 October 2025 |
138.38 (2.27%) |
136.69 |
135.28 - 140.63 |
0.7106 times |
Fri 26 September 2025 |
135.31 (-1.03%) |
136.26 |
131.95 - 138.59 |
0.8784 times |
Fri 19 September 2025 |
136.72 (4.25%) |
131.91 |
130.02 - 137.01 |
1.025 times |
Fri 12 September 2025 |
131.15 (3.63%) |
127.58 |
126.98 - 131.67 |
1.2814 times |
Fri 05 September 2025 |
126.56 (1.88%) |
120.29 |
119.47 - 128.80 |
1.3129 times |
Fri 29 August 2025 |
124.22 (0%) |
126.15 |
123.44 - 126.28 |
0.2864 times |
Fri 29 August 2025 |
124.22 (-0.74%) |
124.42 |
123.44 - 127.67 |
1.335 times |
Fri 22 August 2025 |
125.14 (-1.97%) |
127.26 |
119.52 - 127.85 |
1.2775 times |
Monthly price and charts UltraQqq Strong monthly Stock price targets for UltraQqq QLD are 137.83 and 150.83 | Monthly Target 1 | 127.1 | | Monthly Target 2 | 135.56 | | Monthly Target 3 | 140.1 | | Monthly Target 4 | 148.56 | | Monthly Target 5 | 153.1 |
Monthly price and volumes Ultra Qqq
| Date |
Closing |
Open |
Range |
Volume |
Fri 24 October 2025 |
144.02 (4.97%) |
135.74 |
131.64 - 144.64 |
0.6517 times |
Tue 30 September 2025 |
137.20 (10.45%) |
120.29 |
119.47 - 138.59 |
0.8709 times |
Fri 29 August 2025 |
124.22 (1.18%) |
120.05 |
116.80 - 130.42 |
0.9515 times |
Thu 31 July 2025 |
122.77 (4.3%) |
116.85 |
114.70 - 126.98 |
0.8006 times |
Mon 30 June 2025 |
117.71 (12.39%) |
103.94 |
103.46 - 118.18 |
0.7072 times |
Fri 30 May 2025 |
104.73 (18.23%) |
91.53 |
88.93 - 107.74 |
0.9574 times |
Wed 30 April 2025 |
88.58 (-0.34%) |
88.24 |
64.72 - 92.90 |
1.7763 times |
Mon 31 March 2025 |
88.88 (-15.59%) |
106.66 |
84.45 - 107.30 |
1.3582 times |
Fri 28 February 2025 |
105.29 (-6%) |
108.25 |
100.72 - 119.67 |
0.77 times |
Fri 31 January 2025 |
112.01 (3.48%) |
109.54 |
103.09 - 117.37 |
1.1561 times |
Tue 31 December 2024 |
108.24 (0.06%) |
114.84 |
107.39 - 120.68 |
0.5912 times |

DMA SMA EMA moving averages of Ultra Qqq QLD
DMA (daily moving average) of Ultra Qqq QLD
| DMA period | DMA value | | 5 day DMA | 141.4 | | 12 day DMA | 138.8 | | 20 day DMA | 138.87 | | 35 day DMA | 136.4 | | 50 day DMA | 132.9 | | 100 day DMA | 125.42 | | 150 day DMA | 113.78 | | 200 day DMA | 112.06 | EMA (exponential moving average) of Ultra Qqq QLD
| EMA period | EMA current | EMA prev | EMA prev2 | | 5 day EMA | 141.3 | 139.94 | 139.36 | | 12 day EMA | 139.71 | 138.93 | 138.54 | | 20 day EMA | 138.49 | 137.91 | 137.57 | | 35 day EMA | 135.88 | 135.4 | 135.06 | | 50 day EMA | 133.36 | 132.92 | 132.59 |
SMA (simple moving average) of Ultra Qqq QLD
| SMA period | SMA current | SMA prev | SMA prev2 | | 5 day SMA | 141.4 | 140.23 | 139.29 | | 12 day SMA | 138.8 | 138.64 | 138.46 | | 20 day SMA | 138.87 | 138.44 | 138.09 | | 35 day SMA | 136.4 | 135.9 | 135.47 | | 50 day SMA | 132.9 | 132.57 | 132.33 | | 100 day SMA | 125.42 | 125.05 | 124.68 | | 150 day SMA | 113.78 | 113.44 | 113.12 | | 200 day SMA | 112.06 | 111.89 | 111.73 |
|
|
