InsuredNational PZA full analysis,charts,indicators,moving averages,SMA,DMA,EMA,ADX,MACD,RSIInsured National PZA WideScreen charts, DMA,SMA,EMA technical analysis, forecast prediction, by indicators ADX,MACD,RSI,CCI AMEX stock exchange
Daily price and charts and targets InsuredNational Strong Daily Stock price targets for InsuredNational PZA are 23.37 and 23.42 | Daily Target 1 | 23.33 | | Daily Target 2 | 23.36 | | Daily Target 3 | 23.38 | | Daily Target 4 | 23.41 | | Daily Target 5 | 23.43 |
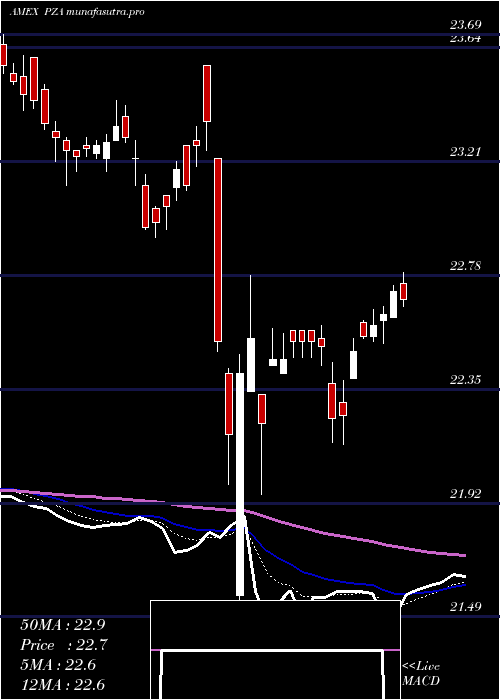
Daily price and volume Insured National
| Date |
Closing |
Open |
Range |
Volume |
Thu 23 October 2025 |
23.39 (0%) |
23.39 |
23.35 - 23.40 |
0.8357 times |
Wed 22 October 2025 |
23.39 (-0.04%) |
23.43 |
23.36 - 23.44 |
1.129 times |
Tue 21 October 2025 |
23.40 (0.09%) |
23.41 |
23.37 - 23.43 |
0.8975 times |
Mon 20 October 2025 |
23.38 (-0.04%) |
23.38 |
23.37 - 23.43 |
0.6731 times |
Fri 17 October 2025 |
23.39 (0.04%) |
23.37 |
23.36 - 23.42 |
0.7159 times |
Thu 16 October 2025 |
23.38 (0.26%) |
23.29 |
23.29 - 23.40 |
0.9481 times |
Wed 15 October 2025 |
23.32 (0.13%) |
23.32 |
23.28 - 23.35 |
1.5527 times |
Tue 14 October 2025 |
23.29 (-0.04%) |
23.29 |
23.27 - 23.32 |
0.8641 times |
Mon 13 October 2025 |
23.30 (0.3%) |
23.22 |
23.21 - 23.30 |
0.7949 times |
Fri 10 October 2025 |
23.23 (0.35%) |
23.26 |
23.19 - 23.27 |
1.5889 times |
Thu 09 October 2025 |
23.15 (0%) |
23.14 |
23.09 - 23.18 |
1.2653 times |
Weekly price and charts InsuredNational Strong weekly Stock price targets for InsuredNational PZA are 23.37 and 23.46 | Weekly Target 1 | 23.3 | | Weekly Target 2 | 23.35 | | Weekly Target 3 | 23.393333333333 | | Weekly Target 4 | 23.44 | | Weekly Target 5 | 23.48 |
Weekly price and volumes for Insured National
| Date |
Closing |
Open |
Range |
Volume |
Thu 23 October 2025 |
23.39 (0%) |
23.38 |
23.35 - 23.44 |
0.4134 times |
Fri 17 October 2025 |
23.39 (0.69%) |
23.22 |
23.21 - 23.42 |
0.5702 times |
Fri 10 October 2025 |
23.23 (0.39%) |
23.13 |
23.06 - 23.27 |
0.9606 times |
Fri 03 October 2025 |
23.14 (0.65%) |
23.03 |
23.02 - 23.18 |
1.558 times |
Fri 26 September 2025 |
22.99 (-0.78%) |
23.09 |
22.95 - 23.10 |
1.0634 times |
Fri 19 September 2025 |
23.17 (0.78%) |
23.00 |
23.00 - 23.27 |
2.3984 times |
Fri 12 September 2025 |
22.99 (1.91%) |
22.63 |
22.62 - 23.04 |
0.8706 times |
Fri 05 September 2025 |
22.56 (1.67%) |
22.19 |
22.12 - 22.57 |
0.814 times |
Fri 29 August 2025 |
22.19 (0%) |
22.18 |
22.18 - 22.22 |
0.1562 times |
Fri 29 August 2025 |
22.19 (0.09%) |
22.16 |
22.11 - 22.23 |
1.1953 times |
Fri 22 August 2025 |
22.17 (-0.09%) |
22.18 |
22.03 - 22.20 |
1.7225 times |

Monthly price and charts InsuredNational Strong monthly Stock price targets for InsuredNational PZA are 23.23 and 23.61 | Monthly Target 1 | 22.92 | | Monthly Target 2 | 23.15 | | Monthly Target 3 | 23.296666666667 | | Monthly Target 4 | 23.53 | | Monthly Target 5 | 23.68 |
Monthly price and volumes Insured National
| Date |
Closing |
Open |
Range |
Volume |
Thu 23 October 2025 |
23.39 (1.3%) |
23.12 |
23.06 - 23.44 |
0.4282 times |
Tue 30 September 2025 |
23.09 (4.06%) |
22.19 |
22.12 - 23.27 |
1.0892 times |
Fri 29 August 2025 |
22.19 (0.54%) |
22.23 |
22.03 - 22.29 |
1.1184 times |
Thu 31 July 2025 |
22.07 (-1.43%) |
22.41 |
21.87 - 22.46 |
1.105 times |
Mon 30 June 2025 |
22.39 (0.18%) |
22.31 |
22.16 - 22.45 |
0.7506 times |
Fri 30 May 2025 |
22.35 (-1.63%) |
22.75 |
22.26 - 22.79 |
0.9864 times |
Wed 30 April 2025 |
22.72 (-1.39%) |
23.11 |
21.49 - 23.57 |
1.8875 times |
Mon 31 March 2025 |
23.04 (-3.03%) |
23.74 |
22.92 - 23.76 |
1.0643 times |
Fri 28 February 2025 |
23.76 (1.28%) |
23.52 |
23.39 - 23.79 |
0.5609 times |
Fri 31 January 2025 |
23.46 (-0.64%) |
23.64 |
23.19 - 23.76 |
1.0097 times |
Tue 31 December 2024 |
23.61 (-1.67%) |
24.24 |
23.39 - 24.26 |
0.5421 times |

DMA SMA EMA moving averages of Insured National PZA
DMA (daily moving average) of Insured National PZA
| DMA period | DMA value | | 5 day DMA | 23.39 | | 12 day DMA | 23.31 | | 20 day DMA | 23.23 | | 35 day DMA | 23.13 | | 50 day DMA | 22.84 | | 100 day DMA | 22.53 | | 150 day DMA | 22.58 | | 200 day DMA | 22.81 | EMA (exponential moving average) of Insured National PZA
| EMA period | EMA current | EMA prev | EMA prev2 | | 5 day EMA | 23.38 | 23.38 | 23.37 | | 12 day EMA | 23.32 | 23.31 | 23.29 | | 20 day EMA | 23.23 | 23.21 | 23.19 | | 35 day EMA | 23.04 | 23.02 | 23 | | 50 day EMA | 22.83 | 22.81 | 22.79 |
SMA (simple moving average) of Insured National PZA
| SMA period | SMA current | SMA prev | SMA prev2 | | 5 day SMA | 23.39 | 23.39 | 23.37 | | 12 day SMA | 23.31 | 23.3 | 23.27 | | 20 day SMA | 23.23 | 23.21 | 23.19 | | 35 day SMA | 23.13 | 23.1 | 23.06 | | 50 day SMA | 22.84 | 22.82 | 22.79 | | 100 day SMA | 22.53 | 22.52 | 22.51 | | 150 day SMA | 22.58 | 22.58 | 22.57 | | 200 day SMA | 22.81 | 22.81 | 22.81 |
|
|
