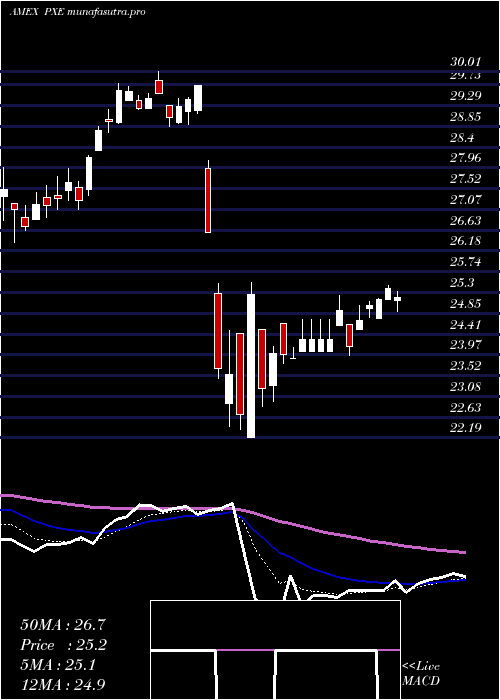
DynamicEnergy PXE full analysis,charts,indicators,moving averages,SMA,DMA,EMA,ADX,MACD,RSIDynamic Energy PXE WideScreen charts, DMA,SMA,EMA technical analysis, forecast prediction, by indicators ADX,MACD,RSI,CCI AMEX stock exchange
Daily price and charts and targets DynamicEnergy Strong Daily Stock price targets for DynamicEnergy PXE are 28.58 and 28.93 | Daily Target 1 | 28.3 | | Daily Target 2 | 28.51 | | Daily Target 3 | 28.65 | | Daily Target 4 | 28.86 | | Daily Target 5 | 29 |
Daily price and volume Dynamic Energy
| Date |
Closing |
Open |
Range |
Volume |
Thu 23 October 2025 |
28.72 (3.31%) |
28.44 |
28.44 - 28.79 |
0.4703 times |
Wed 22 October 2025 |
27.80 (0.76%) |
27.77 |
27.33 - 27.84 |
0.8841 times |
Tue 21 October 2025 |
27.59 (-0.86%) |
27.86 |
27.56 - 27.86 |
1.1844 times |
Mon 20 October 2025 |
27.83 (1.16%) |
27.62 |
27.62 - 27.90 |
0.3945 times |
Fri 17 October 2025 |
27.51 (0.4%) |
27.30 |
27.27 - 27.59 |
0.9249 times |
Thu 16 October 2025 |
27.40 (-2.25%) |
28.14 |
27.21 - 28.14 |
1.7132 times |
Wed 15 October 2025 |
28.03 (0.14%) |
28.23 |
28.01 - 28.34 |
0.9784 times |
Tue 14 October 2025 |
27.99 (-1.13%) |
27.75 |
27.65 - 28.16 |
0.7724 times |
Mon 13 October 2025 |
28.31 (2.83%) |
27.92 |
27.75 - 28.33 |
1.2745 times |
Fri 10 October 2025 |
27.53 (-5.17%) |
28.78 |
27.53 - 28.78 |
1.4033 times |
Thu 09 October 2025 |
29.03 (-2.06%) |
29.96 |
28.99 - 29.96 |
1.9569 times |
Weekly price and charts DynamicEnergy Strong weekly Stock price targets for DynamicEnergy PXE are 28.03 and 29.49 | Weekly Target 1 | 26.82 | | Weekly Target 2 | 27.77 | | Weekly Target 3 | 28.28 | | Weekly Target 4 | 29.23 | | Weekly Target 5 | 29.74 |
Weekly price and volumes for Dynamic Energy
| Date |
Closing |
Open |
Range |
Volume |
Thu 23 October 2025 |
28.72 (4.4%) |
27.62 |
27.33 - 28.79 |
0.4159 times |
Fri 17 October 2025 |
27.51 (-0.07%) |
27.92 |
27.21 - 28.34 |
0.8029 times |
Fri 10 October 2025 |
27.53 (-6.23%) |
29.63 |
27.53 - 29.96 |
1.0872 times |
Fri 03 October 2025 |
29.36 (-3.58%) |
30.39 |
29.08 - 30.39 |
0.7983 times |
Fri 26 September 2025 |
30.45 (5.73%) |
28.43 |
28.43 - 30.87 |
1.1298 times |
Fri 19 September 2025 |
28.80 (-1.17%) |
29.08 |
28.79 - 30.02 |
1.389 times |
Fri 12 September 2025 |
29.14 (0.07%) |
29.30 |
28.68 - 29.63 |
1.0386 times |
Fri 05 September 2025 |
29.12 (-2.22%) |
29.77 |
28.82 - 30.21 |
1.8709 times |
Fri 29 August 2025 |
29.78 (0%) |
29.95 |
29.68 - 29.95 |
0.0967 times |
Fri 29 August 2025 |
29.78 (3.12%) |
28.80 |
28.80 - 29.95 |
1.3707 times |
Fri 22 August 2025 |
28.88 (3.29%) |
27.78 |
27.40 - 28.91 |
1.1043 times |
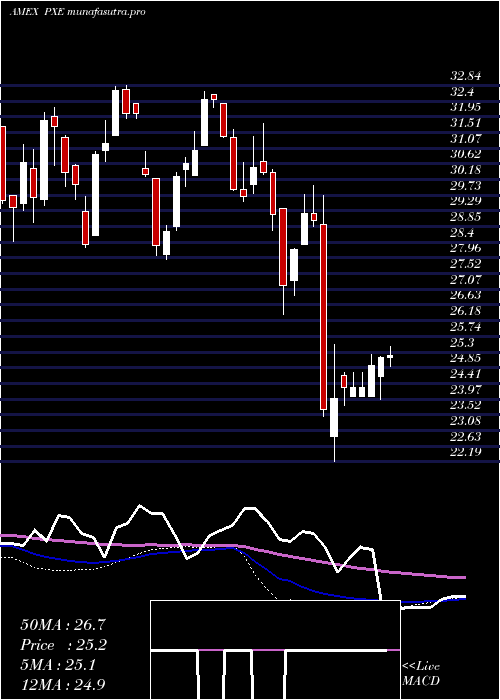
Monthly price and charts DynamicEnergy Strong monthly Stock price targets for DynamicEnergy PXE are 26.59 and 29.34 | Monthly Target 1 | 25.88 | | Monthly Target 2 | 27.3 | | Monthly Target 3 | 28.63 | | Monthly Target 4 | 30.05 | | Monthly Target 5 | 31.38 |
Monthly price and volumes Dynamic Energy
| Date |
Closing |
Open |
Range |
Volume |
Thu 23 October 2025 |
28.72 (-2.28%) |
29.28 |
27.21 - 29.96 |
0.2929 times |
Tue 30 September 2025 |
29.39 (-1.31%) |
29.77 |
28.43 - 30.87 |
0.6249 times |
Fri 29 August 2025 |
29.78 (3.94%) |
28.42 |
27.37 - 29.95 |
0.5915 times |
Thu 31 July 2025 |
28.65 (2.36%) |
28.01 |
27.78 - 29.81 |
0.6693 times |
Mon 30 June 2025 |
27.99 (3.97%) |
27.54 |
26.93 - 30.53 |
0.9778 times |
Fri 30 May 2025 |
26.92 (10.15%) |
24.40 |
24.40 - 28.52 |
1.5428 times |
Wed 30 April 2025 |
24.44 (-16.53%) |
29.16 |
22.19 - 29.72 |
1.4085 times |
Mon 31 March 2025 |
29.28 (0.34%) |
29.36 |
26.36 - 30.01 |
1.6401 times |
Fri 28 February 2025 |
29.18 (-2.44%) |
29.90 |
28.73 - 31.77 |
0.9882 times |
Fri 31 January 2025 |
29.91 (1.05%) |
30.00 |
29.88 - 32.66 |
1.264 times |
Tue 31 December 2024 |
29.60 (-7.64%) |
30.49 |
27.91 - 30.98 |
1.5952 times |

DMA SMA EMA moving averages of Dynamic Energy PXE
DMA (daily moving average) of Dynamic Energy PXE
| DMA period | DMA value | | 5 day DMA | 27.89 | | 12 day DMA | 28.12 | | 20 day DMA | 28.72 | | 35 day DMA | 28.98 | | 50 day DMA | 28.96 | | 100 day DMA | 28.75 | | 150 day DMA | 27.9 | | 200 day DMA | 28.43 | EMA (exponential moving average) of Dynamic Energy PXE
| EMA period | EMA current | EMA prev | EMA prev2 | | 5 day EMA | 28.09 | 27.77 | 27.75 | | 12 day EMA | 28.22 | 28.13 | 28.19 | | 20 day EMA | 28.46 | 28.43 | 28.5 | | 35 day EMA | 28.64 | 28.63 | 28.68 | | 50 day EMA | 28.76 | 28.76 | 28.8 |
SMA (simple moving average) of Dynamic Energy PXE
| SMA period | SMA current | SMA prev | SMA prev2 | | 5 day SMA | 27.89 | 27.63 | 27.67 | | 12 day SMA | 28.12 | 28.19 | 28.34 | | 20 day SMA | 28.72 | 28.8 | 28.91 | | 35 day SMA | 28.98 | 29.01 | 29.05 | | 50 day SMA | 28.96 | 28.95 | 28.95 | | 100 day SMA | 28.75 | 28.73 | 28.72 | | 150 day SMA | 27.9 | 27.91 | 27.92 | | 200 day SMA | 28.43 | 28.44 | 28.45 |
|
|
