InsuredCalifornia PWZ full analysis,charts,indicators,moving averages,SMA,DMA,EMA,ADX,MACD,RSIInsured California PWZ WideScreen charts, DMA,SMA,EMA technical analysis, forecast prediction, by indicators ADX,MACD,RSI,CCI AMEX stock exchange
Daily price and charts and targets InsuredCalifornia Strong Daily Stock price targets for InsuredCalifornia PWZ are 24.28 and 24.44 | Daily Target 1 | 24.16 | | Daily Target 2 | 24.24 | | Daily Target 3 | 24.323333333333 | | Daily Target 4 | 24.4 | | Daily Target 5 | 24.48 |
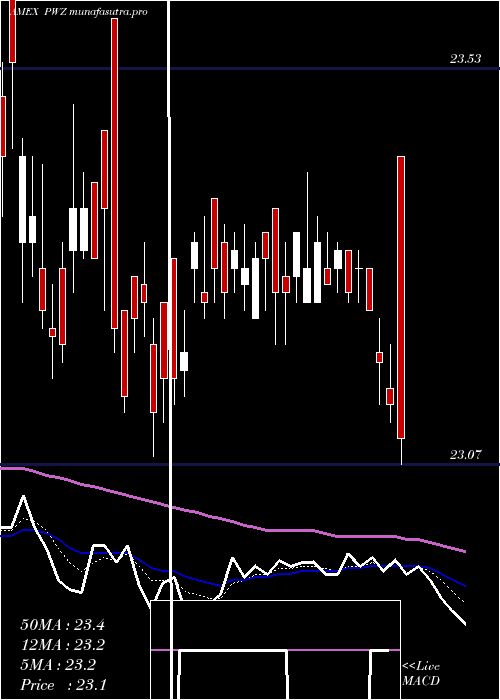
Daily price and volume Insured California
| Date |
Closing |
Open |
Range |
Volume |
Thu 23 October 2025 |
24.31 (0.12%) |
24.26 |
24.25 - 24.41 |
1.6173 times |
Wed 22 October 2025 |
24.28 (-0.04%) |
24.35 |
24.27 - 24.36 |
0.5493 times |
Tue 21 October 2025 |
24.29 (0.08%) |
24.32 |
24.25 - 24.34 |
0.4467 times |
Mon 20 October 2025 |
24.27 (-0.33%) |
24.32 |
24.22 - 24.32 |
0.3706 times |
Fri 17 October 2025 |
24.35 (0.12%) |
24.29 |
24.28 - 24.35 |
0.7599 times |
Thu 16 October 2025 |
24.32 (0.37%) |
24.25 |
24.22 - 24.32 |
0.8916 times |
Wed 15 October 2025 |
24.23 (0.33%) |
24.17 |
24.17 - 24.25 |
3.0437 times |
Tue 14 October 2025 |
24.15 (-0.37%) |
24.21 |
24.06 - 24.22 |
0.6664 times |
Mon 13 October 2025 |
24.24 (0.66%) |
24.08 |
24.08 - 24.24 |
0.2438 times |
Fri 10 October 2025 |
24.08 (0.29%) |
24.11 |
24.05 - 24.12 |
1.4107 times |
Thu 09 October 2025 |
24.01 (0.08%) |
24.04 |
23.95 - 24.04 |
0.5611 times |
Weekly price and charts InsuredCalifornia Strong weekly Stock price targets for InsuredCalifornia PWZ are 24.17 and 24.36 | Weekly Target 1 | 24.12 | | Weekly Target 2 | 24.22 | | Weekly Target 3 | 24.313333333333 | | Weekly Target 4 | 24.41 | | Weekly Target 5 | 24.5 |
Weekly price and volumes for Insured California
| Date |
Closing |
Open |
Range |
Volume |
Thu 23 October 2025 |
24.31 (-0.16%) |
24.32 |
24.22 - 24.41 |
0.2818 times |
Fri 17 October 2025 |
24.35 (1.12%) |
24.08 |
24.06 - 24.35 |
0.5293 times |
Fri 10 October 2025 |
24.08 (0.5%) |
23.98 |
23.94 - 24.12 |
0.6205 times |
Fri 03 October 2025 |
23.96 (0.38%) |
23.86 |
23.86 - 24.45 |
0.6545 times |
Fri 26 September 2025 |
23.87 (-0.58%) |
23.99 |
23.82 - 24.00 |
0.5774 times |
Fri 19 September 2025 |
24.01 (0.46%) |
23.99 |
23.93 - 24.11 |
0.6875 times |
Fri 12 September 2025 |
23.90 (1.53%) |
23.54 |
23.54 - 23.95 |
1.4618 times |
Fri 05 September 2025 |
23.54 (1.82%) |
23.12 |
23.03 - 23.54 |
1.9158 times |
Fri 29 August 2025 |
23.12 (0%) |
23.11 |
23.11 - 23.16 |
0.3332 times |
Fri 29 August 2025 |
23.12 (0.17%) |
23.10 |
23.05 - 23.16 |
2.9382 times |
Fri 22 August 2025 |
23.08 (-0.13%) |
23.02 |
22.97 - 23.12 |
2.2602 times |

Monthly price and charts InsuredCalifornia Strong monthly Stock price targets for InsuredCalifornia PWZ are 24.13 and 24.64 | Monthly Target 1 | 23.72 | | Monthly Target 2 | 24.02 | | Monthly Target 3 | 24.233333333333 | | Monthly Target 4 | 24.53 | | Monthly Target 5 | 24.74 |
Monthly price and volumes Insured California
| Date |
Closing |
Open |
Range |
Volume |
Thu 23 October 2025 |
24.31 (1.63%) |
24.03 |
23.94 - 24.45 |
0.4357 times |
Tue 30 September 2025 |
23.92 (3.46%) |
23.12 |
23.03 - 24.11 |
1.2951 times |
Fri 29 August 2025 |
23.12 (0.96%) |
23.04 |
22.97 - 23.20 |
2.379 times |
Thu 31 July 2025 |
22.90 (-1.89%) |
23.26 |
22.75 - 23.43 |
1.9943 times |
Mon 30 June 2025 |
23.34 (-0.13%) |
23.59 |
23.08 - 23.59 |
1.1301 times |
Fri 30 May 2025 |
23.37 (-0.64%) |
23.67 |
23.17 - 23.70 |
0.951 times |
Wed 30 April 2025 |
23.52 (-1.38%) |
24.01 |
22.23 - 24.39 |
0.8996 times |
Mon 31 March 2025 |
23.85 (-3.17%) |
24.76 |
23.75 - 24.94 |
0.3331 times |
Fri 28 February 2025 |
24.63 (0.94%) |
24.53 |
24.26 - 24.79 |
0.2486 times |
Fri 31 January 2025 |
24.40 (-1.21%) |
24.71 |
24.10 - 24.78 |
0.3335 times |
Tue 31 December 2024 |
24.70 (-1.28%) |
25.23 |
24.44 - 25.26 |
0.2282 times |

DMA SMA EMA moving averages of Insured California PWZ
DMA (daily moving average) of Insured California PWZ
| DMA period | DMA value | | 5 day DMA | 24.3 | | 12 day DMA | 24.21 | | 20 day DMA | 24.11 | | 35 day DMA | 24.01 | | 50 day DMA | 23.74 | | 100 day DMA | 23.43 | | 150 day DMA | 23.43 | | 200 day DMA | 23.7 | EMA (exponential moving average) of Insured California PWZ
| EMA period | EMA current | EMA prev | EMA prev2 | | 5 day EMA | 24.28 | 24.27 | 24.27 | | 12 day EMA | 24.22 | 24.2 | 24.19 | | 20 day EMA | 24.12 | 24.1 | 24.08 | | 35 day EMA | 23.91 | 23.89 | 23.87 | | 50 day EMA | 23.73 | 23.71 | 23.69 |
SMA (simple moving average) of Insured California PWZ
| SMA period | SMA current | SMA prev | SMA prev2 | | 5 day SMA | 24.3 | 24.3 | 24.29 | | 12 day SMA | 24.21 | 24.18 | 24.16 | | 20 day SMA | 24.11 | 24.08 | 24.07 | | 35 day SMA | 24.01 | 23.98 | 23.95 | | 50 day SMA | 23.74 | 23.71 | 23.69 | | 100 day SMA | 23.43 | 23.42 | 23.41 | | 150 day SMA | 23.43 | 23.43 | 23.43 | | 200 day SMA | 23.7 | 23.7 | 23.7 |
|
|
