PacerWealthshield PWS full analysis,charts,indicators,moving averages,SMA,DMA,EMA,ADX,MACD,RSIPacer Wealthshield PWS WideScreen charts, DMA,SMA,EMA technical analysis, forecast prediction, by indicators ADX,MACD,RSI,CCI AMEX stock exchange
Daily price and charts and targets PacerWealthshield Strong Daily Stock price targets for PacerWealthshield PWS are 32.53 and 32.56 | Daily Target 1 | 32.5 | | Daily Target 2 | 32.52 | | Daily Target 3 | 32.53 | | Daily Target 4 | 32.55 | | Daily Target 5 | 32.56 |
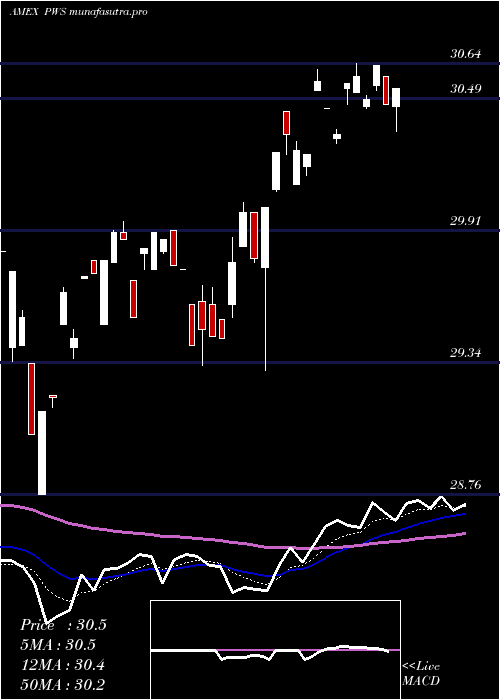
Daily price and volume Pacer Wealthshield
| Date |
Closing |
Open |
Range |
Volume |
Thu 23 October 2025 |
32.54 (-0.03%) |
32.51 |
32.51 - 32.54 |
0.0778 times |
Wed 22 October 2025 |
32.55 (-1.39%) |
32.79 |
32.55 - 32.79 |
0.0376 times |
Tue 21 October 2025 |
33.01 (0.64%) |
32.94 |
32.94 - 33.02 |
0.1527 times |
Mon 20 October 2025 |
32.80 (1.3%) |
32.74 |
32.74 - 32.80 |
0.0194 times |
Fri 17 October 2025 |
32.38 (0.31%) |
32.25 |
32.18 - 32.38 |
8.7414 times |
Thu 16 October 2025 |
32.28 (-0.52%) |
32.70 |
32.22 - 32.70 |
0.1235 times |
Wed 15 October 2025 |
32.45 (0.68%) |
32.63 |
32.15 - 32.63 |
0.6317 times |
Tue 14 October 2025 |
32.23 (-0.25%) |
32.09 |
32.09 - 32.23 |
0.0263 times |
Mon 13 October 2025 |
32.31 (1.44%) |
32.05 |
32.05 - 32.32 |
0.0474 times |
Fri 10 October 2025 |
31.85 (-2.69%) |
32.73 |
31.85 - 32.73 |
0.1421 times |
Thu 09 October 2025 |
32.73 (0%) |
32.67 |
32.65 - 32.73 |
0.1948 times |
Weekly price and charts PacerWealthshield Strong weekly Stock price targets for PacerWealthshield PWS are 32.27 and 32.78 | Weekly Target 1 | 32.18 | | Weekly Target 2 | 32.36 | | Weekly Target 3 | 32.69 | | Weekly Target 4 | 32.87 | | Weekly Target 5 | 33.2 |
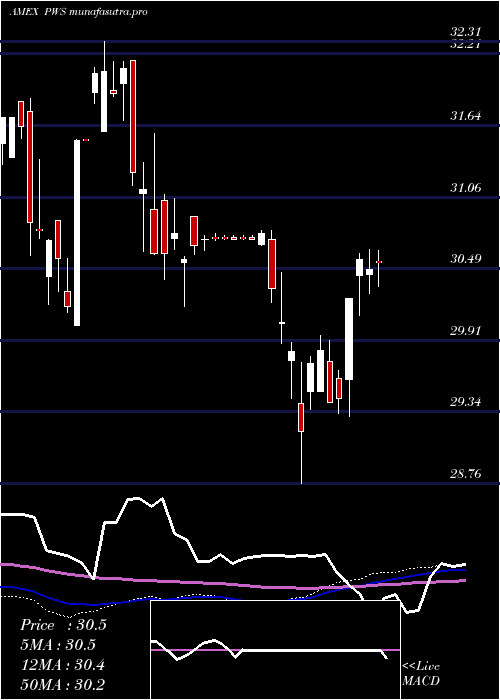
Weekly price and volumes for Pacer Wealthshield
| Date |
Closing |
Open |
Range |
Volume |
Thu 23 October 2025 |
32.54 (0.49%) |
32.74 |
32.51 - 33.02 |
0.2146 times |
Fri 17 October 2025 |
32.38 (1.66%) |
32.05 |
32.05 - 32.70 |
7.1441 times |
Fri 10 October 2025 |
31.85 (-1.52%) |
32.46 |
31.85 - 32.79 |
0.5565 times |
Fri 03 October 2025 |
32.34 (0.97%) |
32.17 |
32.00 - 32.40 |
0.4382 times |
Fri 26 September 2025 |
32.03 (0.09%) |
31.95 |
31.75 - 32.16 |
0.2712 times |
Fri 19 September 2025 |
32.00 (1.2%) |
31.72 |
31.55 - 32.00 |
0.3105 times |
Fri 12 September 2025 |
31.62 (1.51%) |
31.17 |
31.15 - 31.72 |
0.1768 times |
Fri 05 September 2025 |
31.15 (-0.67%) |
31.02 |
30.85 - 31.35 |
0.1926 times |
Fri 29 August 2025 |
31.36 (0%) |
31.33 |
31.31 - 31.38 |
0.0511 times |
Fri 29 August 2025 |
31.36 (-0.13%) |
31.36 |
31.26 - 31.64 |
0.6445 times |
Fri 22 August 2025 |
31.40 (0.61%) |
31.24 |
30.85 - 31.56 |
0.507 times |
Monthly price and charts PacerWealthshield Strong monthly Stock price targets for PacerWealthshield PWS are 32.2 and 33.37 | Monthly Target 1 | 31.3 | | Monthly Target 2 | 31.92 | | Monthly Target 3 | 32.47 | | Monthly Target 4 | 33.09 | | Monthly Target 5 | 33.64 |
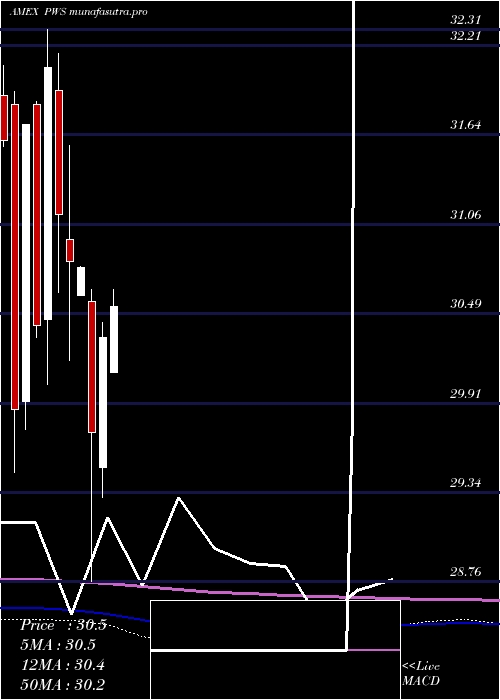
Monthly price and volumes Pacer Wealthshield
| Date |
Closing |
Open |
Range |
Volume |
Thu 23 October 2025 |
32.54 (1.12%) |
32.17 |
31.85 - 33.02 |
1.7421 times |
Tue 30 September 2025 |
32.18 (2.61%) |
31.02 |
30.85 - 32.18 |
0.2196 times |
Fri 29 August 2025 |
31.36 (0.51%) |
30.69 |
30.69 - 31.64 |
0.643 times |
Thu 31 July 2025 |
31.20 (2.87%) |
30.11 |
30.11 - 31.35 |
1.0623 times |
Mon 30 June 2025 |
30.33 (2.05%) |
29.50 |
29.30 - 30.43 |
0.8443 times |
Fri 30 May 2025 |
29.72 (-3.44%) |
30.56 |
28.76 - 30.64 |
0.556 times |
Wed 30 April 2025 |
30.78 (-0.13%) |
30.60 |
30.60 - 30.79 |
2.7188 times |
Mon 31 March 2025 |
30.82 (-0.96%) |
30.96 |
30.18 - 31.57 |
1.0744 times |
Fri 28 February 2025 |
31.12 (-2.96%) |
31.92 |
30.62 - 32.16 |
0.8103 times |
Fri 31 January 2025 |
32.07 (5.46%) |
30.45 |
30.03 - 32.31 |
0.3293 times |
Tue 31 December 2024 |
30.41 (-4.07%) |
31.83 |
30.33 - 31.85 |
0.1931 times |
DMA SMA EMA moving averages of Pacer Wealthshield PWS
DMA (daily moving average) of Pacer Wealthshield PWS
| DMA period | DMA value | | 5 day DMA | 32.66 | | 12 day DMA | 32.49 | | 20 day DMA | 32.41 | | 35 day DMA | 32.09 | | 50 day DMA | 31.85 | | 100 day DMA | 31.16 | | 150 day DMA | 30.87 | | 200 day DMA | 31 | EMA (exponential moving average) of Pacer Wealthshield PWS
| EMA period | EMA current | EMA prev | EMA prev2 | | 5 day EMA | 32.59 | 32.62 | 32.66 | | 12 day EMA | 32.5 | 32.49 | 32.48 | | 20 day EMA | 32.38 | 32.36 | 32.34 | | 35 day EMA | 32.13 | 32.11 | 32.08 | | 50 day EMA | 31.89 | 31.86 | 31.83 |
SMA (simple moving average) of Pacer Wealthshield PWS
| SMA period | SMA current | SMA prev | SMA prev2 | | 5 day SMA | 32.66 | 32.6 | 32.58 | | 12 day SMA | 32.49 | 32.47 | 32.48 | | 20 day SMA | 32.41 | 32.37 | 32.34 | | 35 day SMA | 32.09 | 32.06 | 32.02 | | 50 day SMA | 31.85 | 31.83 | 31.8 | | 100 day SMA | 31.16 | 31.13 | 31.1 | | 150 day SMA | 30.87 | 30.86 | 30.85 | | 200 day SMA | 31 | 30.99 | 30.98 |
|
|
