PacerTrendpilot PTMC full analysis,charts,indicators,moving averages,SMA,DMA,EMA,ADX,MACD,RSIPacer Trendpilot PTMC WideScreen charts, DMA,SMA,EMA technical analysis, forecast prediction, by indicators ADX,MACD,RSI,CCI AMEX stock exchange
Daily price and charts and targets PacerTrendpilot Strong Daily Stock price targets for PacerTrendpilot PTMC are 35.74 and 36.22 | Daily Target 1 | 35.35 | | Daily Target 2 | 35.64 | | Daily Target 3 | 35.826666666667 | | Daily Target 4 | 36.12 | | Daily Target 5 | 36.31 |
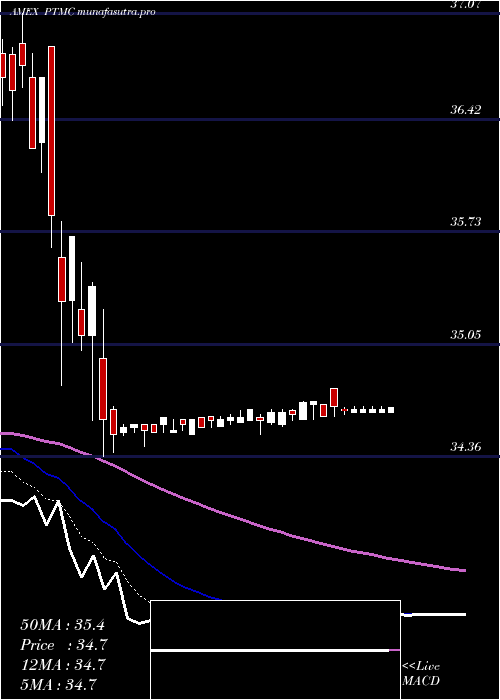
Daily price and volume Pacer Trendpilot
| Date |
Closing |
Open |
Range |
Volume |
Thu 23 October 2025 |
35.94 (1.35%) |
35.55 |
35.53 - 36.01 |
0.6877 times |
Wed 22 October 2025 |
35.46 (-1.34%) |
35.80 |
35.35 - 35.95 |
0.4261 times |
Tue 21 October 2025 |
35.94 (0.53%) |
35.67 |
35.67 - 35.99 |
0.286 times |
Mon 20 October 2025 |
35.75 (1.19%) |
35.44 |
35.44 - 35.79 |
0.7063 times |
Fri 17 October 2025 |
35.33 (0.26%) |
35.29 |
35.13 - 35.40 |
0.9506 times |
Thu 16 October 2025 |
35.24 (-1.18%) |
35.59 |
35.12 - 35.75 |
0.5169 times |
Wed 15 October 2025 |
35.66 (-0.06%) |
35.94 |
35.45 - 36.05 |
0.7947 times |
Tue 14 October 2025 |
35.68 (0.93%) |
35.04 |
35.03 - 35.84 |
4.2648 times |
Mon 13 October 2025 |
35.35 (1.93%) |
35.08 |
35.08 - 35.45 |
0.6024 times |
Fri 10 October 2025 |
34.68 (-2.75%) |
35.80 |
34.67 - 35.80 |
0.7644 times |
Thu 09 October 2025 |
35.66 (-1.11%) |
36.00 |
35.59 - 36.10 |
0.4809 times |
Weekly price and charts PacerTrendpilot Strong weekly Stock price targets for PacerTrendpilot PTMC are 35.65 and 36.31 | Weekly Target 1 | 35.11 | | Weekly Target 2 | 35.52 | | Weekly Target 3 | 35.766666666667 | | Weekly Target 4 | 36.18 | | Weekly Target 5 | 36.43 |
Weekly price and volumes for Pacer Trendpilot
| Date |
Closing |
Open |
Range |
Volume |
Thu 23 October 2025 |
35.94 (1.73%) |
35.44 |
35.35 - 36.01 |
0.6396 times |
Fri 17 October 2025 |
35.33 (1.87%) |
35.08 |
35.03 - 36.05 |
2.165 times |
Fri 10 October 2025 |
34.68 (-3.8%) |
36.21 |
34.67 - 36.25 |
0.9016 times |
Fri 03 October 2025 |
36.05 (0.73%) |
36.01 |
35.47 - 36.24 |
0.7314 times |
Fri 26 September 2025 |
35.79 (-0.47%) |
35.82 |
35.26 - 36.26 |
0.8485 times |
Fri 19 September 2025 |
35.96 (-0.03%) |
36.14 |
35.67 - 36.39 |
1.3566 times |
Fri 12 September 2025 |
35.97 (-0.28%) |
36.12 |
35.62 - 36.33 |
1.445 times |
Fri 05 September 2025 |
36.07 (1.26%) |
35.26 |
35.20 - 36.37 |
0.6987 times |
Fri 29 August 2025 |
35.62 (0%) |
35.80 |
35.52 - 35.80 |
0.1491 times |
Fri 29 August 2025 |
35.62 (-0.06%) |
35.55 |
35.37 - 35.89 |
1.0645 times |
Fri 22 August 2025 |
35.64 (2.62%) |
34.78 |
34.55 - 35.78 |
1.4073 times |

Monthly price and charts PacerTrendpilot Strong monthly Stock price targets for PacerTrendpilot PTMC are 35.31 and 36.89 | Monthly Target 1 | 34.04 | | Monthly Target 2 | 34.99 | | Monthly Target 3 | 35.62 | | Monthly Target 4 | 36.57 | | Monthly Target 5 | 37.2 |
Monthly price and volumes Pacer Trendpilot
| Date |
Closing |
Open |
Range |
Volume |
Thu 23 October 2025 |
35.94 (0.36%) |
35.60 |
34.67 - 36.25 |
0.5121 times |
Tue 30 September 2025 |
35.81 (0.53%) |
35.26 |
35.20 - 36.39 |
0.5965 times |
Fri 29 August 2025 |
35.62 (3.34%) |
34.01 |
33.60 - 35.89 |
1.0539 times |
Thu 31 July 2025 |
34.47 (-1.18%) |
34.88 |
33.88 - 35.38 |
1.3501 times |
Mon 30 June 2025 |
34.88 (0.06%) |
34.83 |
34.76 - 34.91 |
0.8628 times |
Fri 30 May 2025 |
34.86 (0.55%) |
34.70 |
34.67 - 34.95 |
1.599 times |
Wed 30 April 2025 |
34.67 (0.2%) |
34.57 |
34.50 - 34.78 |
1.723 times |
Mon 31 March 2025 |
34.60 (-5.67%) |
36.87 |
34.36 - 36.87 |
0.9993 times |
Fri 28 February 2025 |
36.68 (-4.33%) |
37.46 |
36.10 - 38.53 |
0.6016 times |
Fri 31 January 2025 |
38.34 (3.93%) |
37.21 |
36.40 - 39.05 |
0.7018 times |
Tue 31 December 2024 |
36.89 (-8.33%) |
39.83 |
36.53 - 39.89 |
0.5845 times |

DMA SMA EMA moving averages of Pacer Trendpilot PTMC
DMA (daily moving average) of Pacer Trendpilot PTMC
| DMA period | DMA value | | 5 day DMA | 35.68 | | 12 day DMA | 35.56 | | 20 day DMA | 35.69 | | 35 day DMA | 35.78 | | 50 day DMA | 35.65 | | 100 day DMA | 35.2 | | 150 day DMA | 35.03 | | 200 day DMA | 35.53 | EMA (exponential moving average) of Pacer Trendpilot PTMC
| EMA period | EMA current | EMA prev | EMA prev2 | | 5 day EMA | 35.71 | 35.59 | 35.66 | | 12 day EMA | 35.65 | 35.6 | 35.63 | | 20 day EMA | 35.65 | 35.62 | 35.64 | | 35 day EMA | 35.61 | 35.59 | 35.6 | | 50 day EMA | 35.58 | 35.57 | 35.57 |
SMA (simple moving average) of Pacer Trendpilot PTMC
| SMA period | SMA current | SMA prev | SMA prev2 | | 5 day SMA | 35.68 | 35.54 | 35.58 | | 12 day SMA | 35.56 | 35.54 | 35.6 | | 20 day SMA | 35.69 | 35.66 | 35.67 | | 35 day SMA | 35.78 | 35.78 | 35.78 | | 50 day SMA | 35.65 | 35.63 | 35.63 | | 100 day SMA | 35.2 | 35.19 | 35.18 | | 150 day SMA | 35.03 | 35.02 | 35.01 | | 200 day SMA | 35.53 | 35.54 | 35.55 |
|
|
