PacerTrendpilot PTLC full analysis,charts,indicators,moving averages,SMA,DMA,EMA,ADX,MACD,RSIPacer Trendpilot PTLC WideScreen charts, DMA,SMA,EMA technical analysis, forecast prediction, by indicators ADX,MACD,RSI,CCI AMEX stock exchange
Daily price and charts and targets PacerTrendpilot Strong Daily Stock price targets for PacerTrendpilot PTLC are 55.07 and 55.49 | Daily Target 1 | 54.73 | | Daily Target 2 | 54.99 | | Daily Target 3 | 55.153333333333 | | Daily Target 4 | 55.41 | | Daily Target 5 | 55.57 |
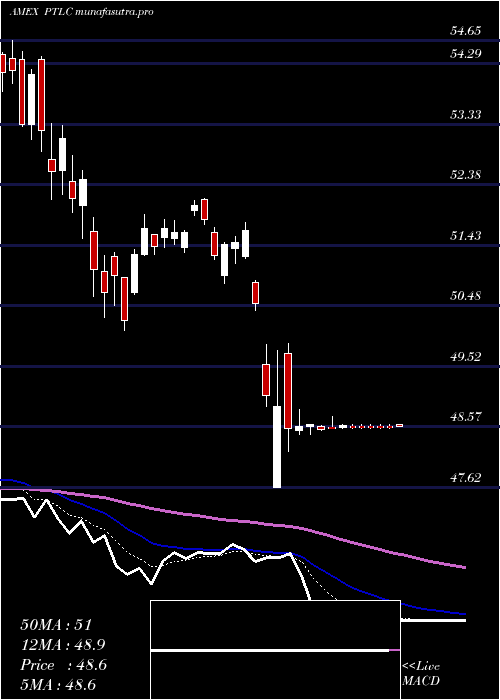
Daily price and volume Pacer Trendpilot
| Date |
Closing |
Open |
Range |
Volume |
Thu 23 October 2025 |
55.24 (0.62%) |
54.92 |
54.90 - 55.32 |
0.8322 times |
Wed 22 October 2025 |
54.90 (-0.54%) |
55.20 |
54.56 - 55.25 |
0.63 times |
Tue 21 October 2025 |
55.20 (0%) |
55.16 |
55.13 - 55.33 |
0.558 times |
Mon 20 October 2025 |
55.20 (1.08%) |
54.87 |
54.87 - 55.28 |
0.5906 times |
Fri 17 October 2025 |
54.61 (0.5%) |
54.22 |
54.11 - 54.75 |
1.7522 times |
Thu 16 October 2025 |
54.34 (-0.68%) |
54.81 |
54.06 - 54.99 |
1.2054 times |
Wed 15 October 2025 |
54.71 (0.46%) |
54.86 |
54.23 - 55.10 |
1.362 times |
Tue 14 October 2025 |
54.46 (-0.15%) |
54.00 |
53.73 - 54.74 |
0.8124 times |
Mon 13 October 2025 |
54.54 (1.56%) |
54.40 |
54.24 - 54.63 |
0.8262 times |
Fri 10 October 2025 |
53.70 (-2.7%) |
55.19 |
53.70 - 55.42 |
1.4312 times |
Thu 09 October 2025 |
55.19 (-0.33%) |
55.42 |
55.05 - 55.42 |
0.6043 times |
Weekly price and charts PacerTrendpilot Strong weekly Stock price targets for PacerTrendpilot PTLC are 54.9 and 55.67 | Weekly Target 1 | 54.27 | | Weekly Target 2 | 54.76 | | Weekly Target 3 | 55.043333333333 | | Weekly Target 4 | 55.53 | | Weekly Target 5 | 55.81 |
Weekly price and volumes for Pacer Trendpilot
| Date |
Closing |
Open |
Range |
Volume |
Thu 23 October 2025 |
55.24 (1.15%) |
54.87 |
54.56 - 55.33 |
0.5951 times |
Fri 17 October 2025 |
54.61 (1.69%) |
54.40 |
53.73 - 55.10 |
1.3582 times |
Fri 10 October 2025 |
53.70 (-2.42%) |
55.24 |
53.70 - 55.42 |
1.0523 times |
Fri 03 October 2025 |
55.03 (1.12%) |
54.64 |
54.43 - 55.32 |
1.2361 times |
Fri 26 September 2025 |
54.42 (-0.33%) |
54.52 |
53.86 - 54.91 |
1.1112 times |
Fri 19 September 2025 |
54.60 (1.2%) |
54.10 |
53.70 - 54.66 |
1.3542 times |
Fri 12 September 2025 |
53.95 (1.62%) |
53.24 |
53.12 - 54.08 |
1.2025 times |
Fri 05 September 2025 |
53.09 (0.28%) |
52.29 |
52.11 - 53.51 |
0.8674 times |
Fri 29 August 2025 |
52.94 (0%) |
53.12 |
52.79 - 53.13 |
0.1522 times |
Fri 29 August 2025 |
52.94 (-0.04%) |
52.92 |
52.60 - 53.29 |
1.0707 times |
Fri 22 August 2025 |
52.96 (0.27%) |
52.72 |
51.97 - 53.07 |
1.2514 times |

Monthly price and charts PacerTrendpilot Strong monthly Stock price targets for PacerTrendpilot PTLC are 54.47 and 56.19 | Monthly Target 1 | 53.07 | | Monthly Target 2 | 54.15 | | Monthly Target 3 | 54.786666666667 | | Monthly Target 4 | 55.87 | | Monthly Target 5 | 56.51 |
Monthly price and volumes Pacer Trendpilot
| Date |
Closing |
Open |
Range |
Volume |
Thu 23 October 2025 |
55.24 (0.88%) |
54.52 |
53.70 - 55.42 |
0.4018 times |
Tue 30 September 2025 |
54.76 (3.44%) |
52.29 |
52.11 - 54.91 |
0.5655 times |
Fri 29 August 2025 |
52.94 (2.08%) |
51.34 |
50.84 - 53.29 |
0.5073 times |
Thu 31 July 2025 |
51.86 (2.17%) |
50.55 |
50.55 - 52.51 |
0.7418 times |
Mon 30 June 2025 |
50.76 (5.09%) |
48.19 |
47.93 - 50.83 |
0.914 times |
Fri 30 May 2025 |
48.30 (-0.8%) |
48.67 |
47.13 - 49.01 |
1.7198 times |
Wed 30 April 2025 |
48.69 (-5.36%) |
51.38 |
47.62 - 51.78 |
2.6196 times |
Mon 31 March 2025 |
51.45 (-4.93%) |
54.35 |
50.08 - 54.40 |
1.1859 times |
Fri 28 February 2025 |
54.12 (-1.4%) |
54.06 |
53.09 - 55.90 |
0.6033 times |
Fri 31 January 2025 |
54.89 (2.71%) |
53.81 |
52.40 - 55.72 |
0.741 times |
Tue 31 December 2024 |
53.44 (-2.85%) |
55.69 |
53.32 - 55.69 |
0.3673 times |

DMA SMA EMA moving averages of Pacer Trendpilot PTLC
DMA (daily moving average) of Pacer Trendpilot PTLC
| DMA period | DMA value | | 5 day DMA | 55.03 | | 12 day DMA | 54.79 | | 20 day DMA | 54.83 | | 35 day DMA | 54.49 | | 50 day DMA | 53.98 | | 100 day DMA | 52.39 | | 150 day DMA | 51.26 | | 200 day DMA | 51.91 | EMA (exponential moving average) of Pacer Trendpilot PTLC
| EMA period | EMA current | EMA prev | EMA prev2 | | 5 day EMA | 55.02 | 54.91 | 54.91 | | 12 day EMA | 54.87 | 54.8 | 54.78 | | 20 day EMA | 54.72 | 54.66 | 54.64 | | 35 day EMA | 54.36 | 54.31 | 54.27 | | 50 day EMA | 53.97 | 53.92 | 53.88 |
SMA (simple moving average) of Pacer Trendpilot PTLC
| SMA period | SMA current | SMA prev | SMA prev2 | | 5 day SMA | 55.03 | 54.85 | 54.81 | | 12 day SMA | 54.79 | 54.77 | 54.8 | | 20 day SMA | 54.83 | 54.77 | 54.75 | | 35 day SMA | 54.49 | 54.43 | 54.37 | | 50 day SMA | 53.98 | 53.94 | 53.9 | | 100 day SMA | 52.39 | 52.32 | 52.25 | | 150 day SMA | 51.26 | 51.24 | 51.22 | | 200 day SMA | 51.91 | 51.91 | 51.9 |
|
|
