PacerTrendpilot PTIN full analysis,charts,indicators,moving averages,SMA,DMA,EMA,ADX,MACD,RSIPacer Trendpilot PTIN WideScreen charts, DMA,SMA,EMA technical analysis, forecast prediction, by indicators ADX,MACD,RSI,CCI AMEX stock exchange
Daily price and charts and targets PacerTrendpilot Strong Daily Stock price targets for PacerTrendpilot PTIN are 31.14 and 31.3 | Daily Target 1 | 31.02 | | Daily Target 2 | 31.09 | | Daily Target 3 | 31.18 | | Daily Target 4 | 31.25 | | Daily Target 5 | 31.34 |
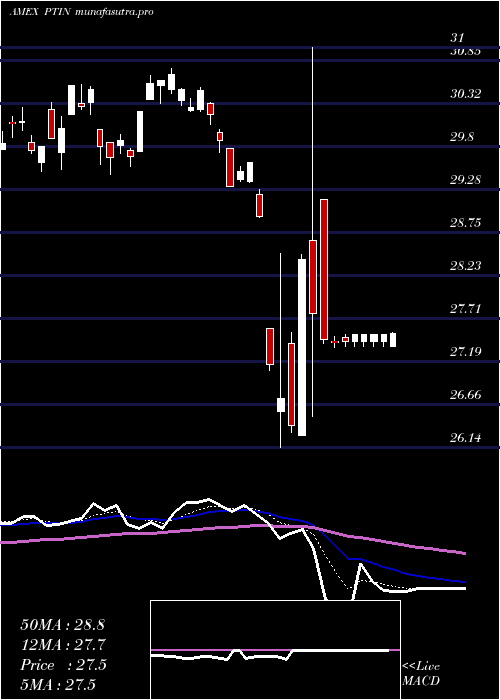
Daily price and volume Pacer Trendpilot
| Date |
Closing |
Open |
Range |
Volume |
Thu 23 October 2025 |
31.16 (0.42%) |
31.14 |
31.11 - 31.27 |
1.9438 times |
Wed 22 October 2025 |
31.03 (-0.13%) |
31.09 |
30.80 - 31.14 |
0.5186 times |
Tue 21 October 2025 |
31.07 (-0.58%) |
31.09 |
31.07 - 31.10 |
1.2649 times |
Mon 20 October 2025 |
31.25 (0.81%) |
31.22 |
31.22 - 31.28 |
0.7732 times |
Fri 17 October 2025 |
31.00 (0.23%) |
30.89 |
30.85 - 31.04 |
0.4947 times |
Thu 16 October 2025 |
30.93 (0.49%) |
30.99 |
30.89 - 31.13 |
0.7121 times |
Wed 15 October 2025 |
30.78 (0.72%) |
30.83 |
30.73 - 30.98 |
0.8881 times |
Tue 14 October 2025 |
30.56 (0.39%) |
30.25 |
30.23 - 30.72 |
0.7536 times |
Mon 13 October 2025 |
30.44 (0.86%) |
30.37 |
30.33 - 30.50 |
1.6955 times |
Fri 10 October 2025 |
30.18 (-1.95%) |
30.18 |
30.18 - 30.75 |
0.9554 times |
Thu 09 October 2025 |
30.78 (-0.9%) |
31.13 |
30.66 - 31.13 |
0.8881 times |
Weekly price and charts PacerTrendpilot Strong weekly Stock price targets for PacerTrendpilot PTIN are 30.74 and 31.22 | Weekly Target 1 | 30.6 | | Weekly Target 2 | 30.88 | | Weekly Target 3 | 31.08 | | Weekly Target 4 | 31.36 | | Weekly Target 5 | 31.56 |
Weekly price and volumes for Pacer Trendpilot
| Date |
Closing |
Open |
Range |
Volume |
Thu 23 October 2025 |
31.16 (0.52%) |
31.22 |
30.80 - 31.28 |
0.7139 times |
Fri 17 October 2025 |
31.00 (2.72%) |
30.37 |
30.23 - 31.13 |
0.7208 times |
Fri 10 October 2025 |
30.18 (-2.99%) |
31.28 |
30.18 - 31.35 |
0.8101 times |
Fri 03 October 2025 |
31.11 (2.78%) |
30.47 |
30.41 - 31.20 |
0.8924 times |
Fri 26 September 2025 |
30.27 (-0.59%) |
30.58 |
30.10 - 30.73 |
1.4644 times |
Fri 19 September 2025 |
30.45 (0.4%) |
30.44 |
30.34 - 30.64 |
2.7835 times |
Fri 12 September 2025 |
30.33 (1.47%) |
30.13 |
30.03 - 30.48 |
0.7962 times |
Fri 05 September 2025 |
29.89 (0.5%) |
29.35 |
29.30 - 30.07 |
0.7535 times |
Fri 29 August 2025 |
29.74 (0%) |
29.71 |
29.71 - 29.77 |
0.1708 times |
Fri 29 August 2025 |
29.74 (-1.39%) |
29.99 |
29.56 - 29.99 |
0.8944 times |
Fri 22 August 2025 |
30.16 (1.04%) |
29.78 |
29.67 - 30.18 |
0.7599 times |

Monthly price and charts PacerTrendpilot Strong monthly Stock price targets for PacerTrendpilot PTIN are 30.67 and 31.84 | Monthly Target 1 | 29.73 | | Monthly Target 2 | 30.44 | | Monthly Target 3 | 30.896666666667 | | Monthly Target 4 | 31.61 | | Monthly Target 5 | 32.07 |
Monthly price and volumes Pacer Trendpilot
| Date |
Closing |
Open |
Range |
Volume |
Thu 23 October 2025 |
31.16 (2.26%) |
30.78 |
30.18 - 31.35 |
0.3593 times |
Tue 30 September 2025 |
30.47 (2.45%) |
29.35 |
29.30 - 30.73 |
0.8717 times |
Fri 29 August 2025 |
29.74 (4.79%) |
28.32 |
28.07 - 30.18 |
0.6149 times |
Thu 31 July 2025 |
28.38 (-2.17%) |
28.85 |
25.50 - 29.67 |
1.2633 times |
Mon 30 June 2025 |
29.01 (2.91%) |
28.27 |
26.30 - 29.09 |
1.0308 times |
Fri 30 May 2025 |
28.19 (2.73%) |
27.38 |
26.15 - 28.34 |
1.1011 times |
Wed 30 April 2025 |
27.44 (-6.41%) |
29.40 |
26.14 - 31.00 |
1.8277 times |
Mon 31 March 2025 |
29.32 (-1.61%) |
30.25 |
29.32 - 30.75 |
0.8512 times |
Fri 28 February 2025 |
29.80 (2.51%) |
28.56 |
28.48 - 30.27 |
0.6693 times |
Fri 31 January 2025 |
29.07 (4.76%) |
27.86 |
26.41 - 29.44 |
1.4107 times |
Tue 31 December 2024 |
27.75 (-4.34%) |
29.74 |
27.59 - 29.97 |
1.1488 times |

DMA SMA EMA moving averages of Pacer Trendpilot PTIN
DMA (daily moving average) of Pacer Trendpilot PTIN
| DMA period | DMA value | | 5 day DMA | 31.1 | | 12 day DMA | 30.85 | | 20 day DMA | 30.82 | | 35 day DMA | 30.62 | | 50 day DMA | 30.36 | | 100 day DMA | 29.57 | | 150 day DMA | 29.04 | | 200 day DMA | 29.12 | EMA (exponential moving average) of Pacer Trendpilot PTIN
| EMA period | EMA current | EMA prev | EMA prev2 | | 5 day EMA | 31.06 | 31.01 | 31 | | 12 day EMA | 30.93 | 30.89 | 30.87 | | 20 day EMA | 30.83 | 30.79 | 30.76 | | 35 day EMA | 30.58 | 30.55 | 30.52 | | 50 day EMA | 30.36 | 30.33 | 30.3 |
SMA (simple moving average) of Pacer Trendpilot PTIN
| SMA period | SMA current | SMA prev | SMA prev2 | | 5 day SMA | 31.1 | 31.06 | 31.01 | | 12 day SMA | 30.85 | 30.84 | 30.86 | | 20 day SMA | 30.82 | 30.77 | 30.74 | | 35 day SMA | 30.62 | 30.58 | 30.53 | | 50 day SMA | 30.36 | 30.33 | 30.31 | | 100 day SMA | 29.57 | 29.54 | 29.51 | | 150 day SMA | 29.04 | 29.04 | 29.03 | | 200 day SMA | 29.12 | 29.1 | 29.09 |
|
|
